|
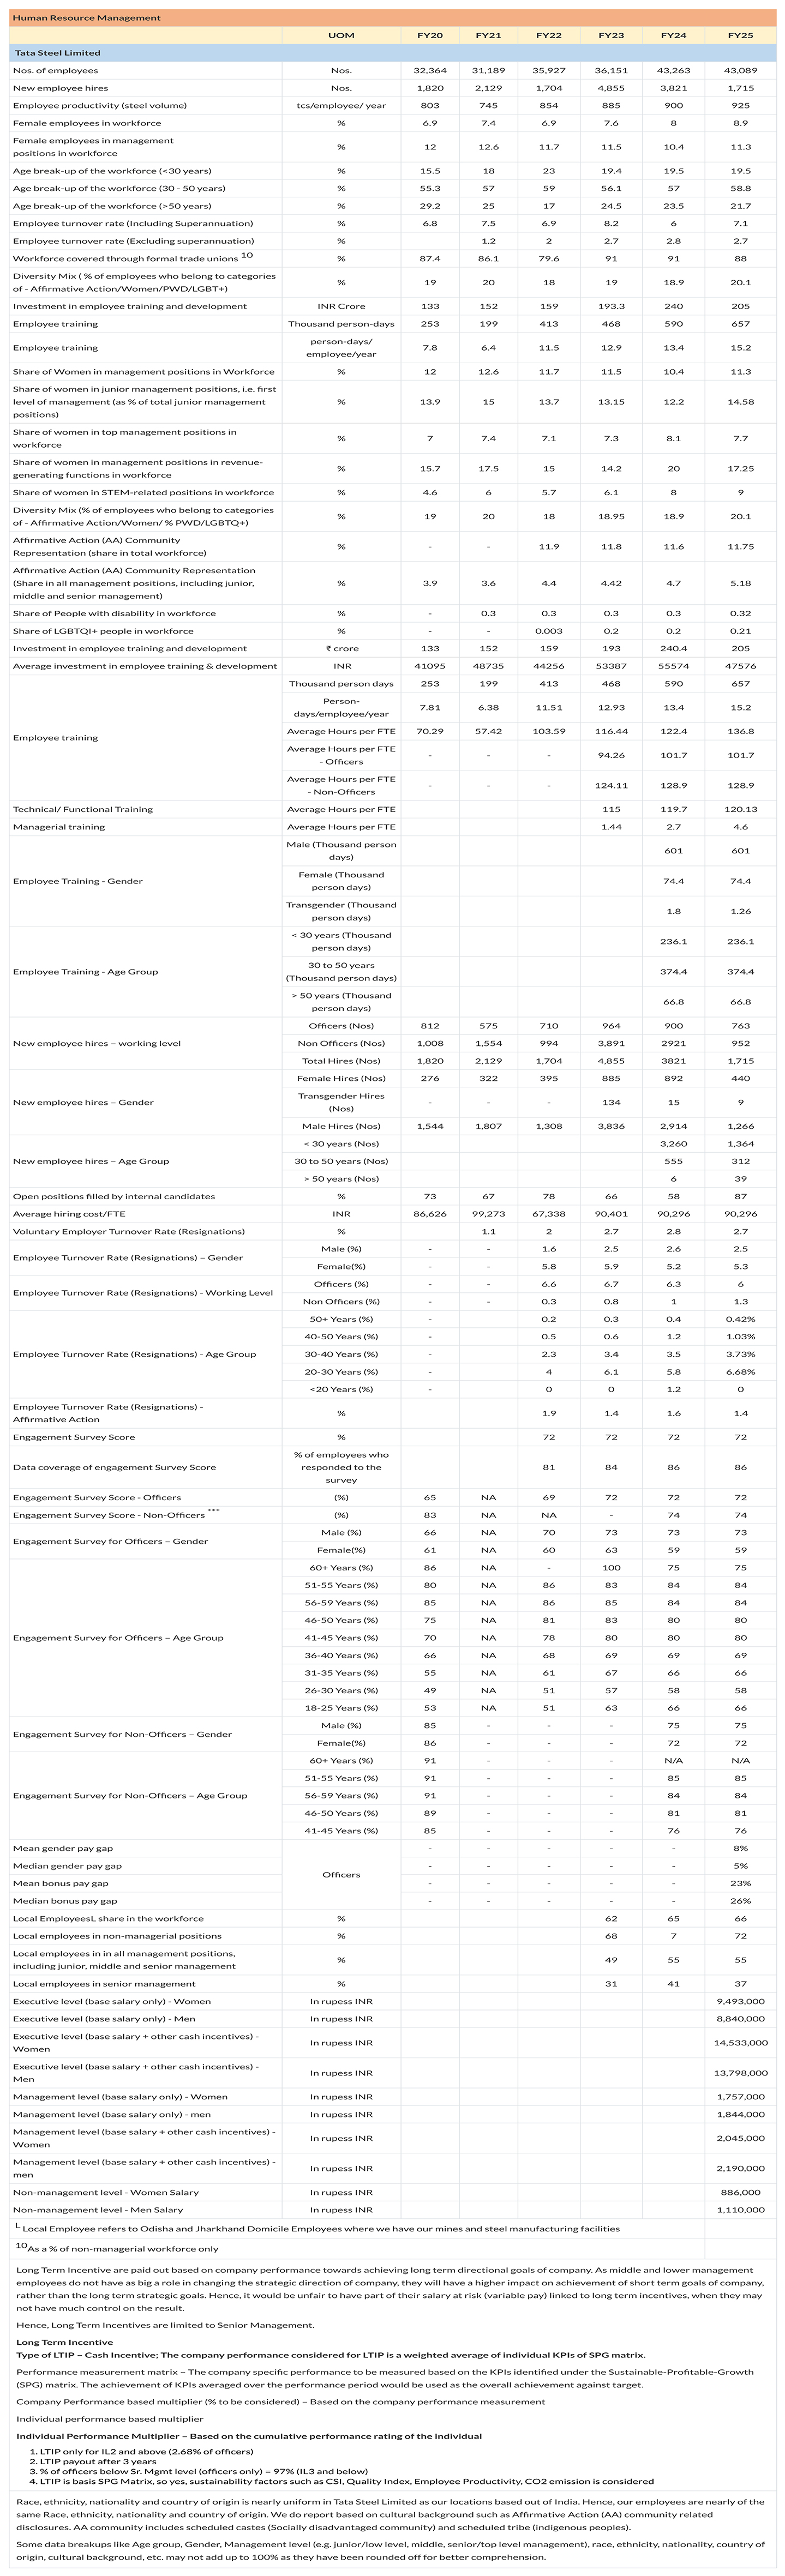
Human Resource Management
|
|
|
|
|
UOM
|
FY20
|
FY21
|
FY22
|
FY23
|
FY24
|
FY25
|
|
Tata Steel Limited
|
|
Nos. of employees
|
Nos.
|
32,364
|
31,189
|
35,927
|
36,151
|
43,263
|
43,089
|
|
New employee hires
|
Nos.
|
1,820
|
2,129
|
1,704
|
4,855
|
3,821
|
1,715
|
|
Employee productivity (steel volume)
|
tcs/employee/ year
|
803
|
745
|
854
|
885
|
900
|
925
|
|
Female employees in workforce
|
%
|
6.9
|
7.4
|
6.9
|
7.6
|
8
|
8.9
|
|
Female employees in management
positions in workforce
|
%
|
12
|
12.6
|
11.7
|
11.5
|
10.4
|
11.3
|
|
Age break-up of the workforce (<30 years)
|
%
|
15.5
|
18
|
23
|
19.4
|
19.5
|
19.5
|
|
Age break-up of the workforce (30 - 50 years)
|
%
|
55.3
|
57
|
59
|
56.1
|
57
|
58.8
|
|
Age break-up of the workforce (>50 years)
|
%
|
29.2
|
25
|
17
|
24.5
|
23.5
|
21.7
|
|
Employee turnover rate (Including Superannuation)
|
%
|
6.8
|
7.5
|
6.9
|
8.2
|
6
|
7.1
|
|
Employee turnover rate (Excluding superannuation)
|
%
|
|
1.2
|
2
|
2.7
|
2.8
|
2.7
|
|
Workforce covered through formal trade unions 10
|
%
|
87.4
|
86.1
|
79.6
|
91
|
91
|
88
|
|
Diversity Mix ( % of employees who belong to categories of - Affirmative Action/Women/PWD/LGBT+)
|
%
|
19
|
20
|
18
|
19
|
18.9
|
20.1
|
|
Investment in employee training and development
|
INR Crore
|
133
|
152
|
159
|
193.3
|
240
|
205
|
|
Employee training
|
Thousand person-days
|
253
|
199
|
413
|
468
|
590
|
657
|
|
Employee training
|
person-days/ employee/year
|
7.8
|
6.4
|
11.5
|
12.9
|
13.4
|
15.2
|
|
Share of Women in management positions in Workforce
|
%
|
12
|
12.6
|
11.7
|
11.5
|
10.4
|
11.3
|
|
Share of women in junior management positions, i.e. first level of management (as % of total junior management positions)
|
%
|
13.9
|
15
|
13.7
|
13.15
|
12.2
|
14.58
|
|
|
Share of women in top management positions in workforce
|
%
|
7
|
7.4
|
7.1
|
7.3
|
8.1
|
7.7
|
|
Share of women in management positions in revenue-generating functions in workforce
|
%
|
15.7
|
17.5
|
15
|
14.2
|
20
|
17.25
|
|
Share of women in STEM-related positions in workforce
|
%
|
4.6
|
6
|
5.7
|
6.1
|
8
|
9
|
|
Diversity Mix (% of employees who belong to categories of - Affirmative Action/Women/ % PWD/LGBTQ+)
|
%
|
19
|
20
|
18
|
18.95
|
18.9
|
20.1
|
|
Affirmative Action (AA) Community
Representation (share in total workforce)
|
%
|
-
|
-
|
11.9
|
11.8
|
11.6
|
11.75
|
|
Affirmative Action (AA) Community Representation
(Share in all management positions, including junior, middle and senior management)
|
%
|
3.9
|
3.6
|
4.4
|
4.42
|
4.7
|
5.18
|
|
Share of People with disability in workforce
|
%
|
-
|
0.3
|
0.3
|
0.3
|
0.3
|
0.32
|
|
Share of LGBTQI+ people in workforce
|
%
|
-
|
-
|
0.003
|
0.2
|
0.2
|
0.21
|
|
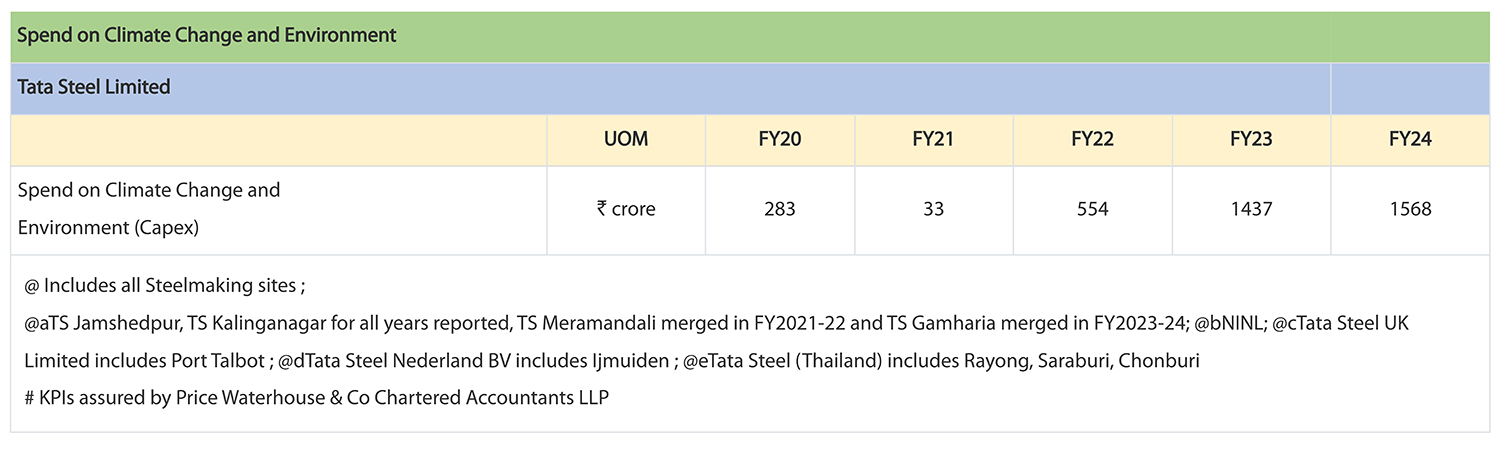
Investment in employee training and development
|
₹ crore
|
133
|
152
|
159
|
193
|
240.4
|
205
|
|
|
Average investment in employee training & development
|
INR
|
41095
|
48735
|
44256
|
53387
|
55574
|
47576
|
|
Employee training
|
Thousand person days
|
253
|
199
|
413
|
468
|
590
|
657
|
|
Person-days/employee/year
|
7.81
|
6.38
|
11.51
|
12.93
|
13.4
|
15.2
|
|
Average Hours per FTE
|
70.29
|
57.42
|
103.59
|
116.44
|
122.4
|
136.8
|
|
Average Hours per FTE - Officers
|
-
|
-
|
-
|
94.26
|
101.7
|
101.7
|
|
Average Hours per FTE - Non-Officers
|
-
|
-
|
-
|
124.11
|
128.9
|
128.9
|
|
Technical/ Functional Training
|
Average Hours per FTE
|
|
|
|
115
|
119.7
|
120.13
|
|
Managerial training
|
Average Hours per FTE
|
|
|
|
1.44
|
2.7
|
4.6
|
|
Employee Training - Gender
|
Male (Thousand person days)
|
|
|
|
|
601
|
601
|
|
Female (Thousand person days)
|
|
|
|
|
74.4
|
74.4
|
|
Transgender (Thousand person days)
|
|
|
|
|
1.8
|
1.26
|
|
Employee Training - Age Group
|
< 30 years (Thousand person days)
|
|
|
|
|
236.1
|
236.1
|
|
30 to 50 years (Thousand person days)
|
|
|
|
|
374.4
|
374.4
|
|
> 50 years (Thousand person days)
|
|
|
|
|
66.8
|
66.8
|
|
New employee hires – working level
|
Officers (Nos)
|
812
|
575
|
710
|
964
|
900
|
763
|
|
Non Officers (Nos)
|
1,008
|
1,554
|
994
|
3,891
|
2921
|
952
|
|
Total Hires (Nos)
|
1,820
|
2,129
|
1,704
|
4,855
|
3821
|
1,715
|
|
New employee hires – Gender
|
Female Hires (Nos)
|
276
|
322
|
395
|
885
|
892
|
440
|
|
Transgender Hires (Nos)
|
-
|
-
|
-
|
134
|
15
|
9
|
|
Male Hires (Nos)
|
1,544
|
1,807
|
1,308
|
3,836
|
2,914
|
1,266
|
|
New employee hires – Age Group
|
< 30 years (Nos)
|
|
|
|
|
3,260
|
1,364
|
|
30 to 50 years (Nos)
|
|
|
|
|
555
|
312
|
|
> 50 years (Nos)
|
|
|
|
|
6
|
39
|
|
Open positions filled by internal candidates
|
%
|
73
|
67
|
78
|
66
|
58
|
87
|
|
Average hiring cost/FTE
|
INR
|
86,626
|
99,273
|
67,338
|
90,401
|
90,296
|
90,296
|
|
Voluntary Employer Turnover Rate (Resignations)
|
%
|
|
1.1
|
2
|
2.7
|
2.8
|
2.7
|
|
Employee Turnover Rate (Resignations) – Gender
|
Male (%)
|
-
|
-
|
1.6
|
2.5
|
2.6
|
2.5
|
|
Female(%)
|
-
|
-
|
5.8
|
5.9
|
5.2
|
5.3
|
|
Employee Turnover Rate (Resignations) - Working Level
|
Officers (%)
|
-
|
-
|
6.6
|
6.7
|
6.3
|
6
|
|
Non Officers (%)
|
-
|
-
|
0.3
|
0.8
|
1
|
1.3
|
|
Employee Turnover Rate (Resignations) - Age Group
|
50+ Years (%)
|
-
|
|
0.2
|
0.3
|
0.4
|
0.42%
|
|
40-50 Years (%)
|
-
|
|
0.5
|
0.6
|
1.2
|
1.03%
|
|
30-40 Years (%)
|
-
|
|
2.3
|
3.4
|
3.5
|
3.73%
|
|
20-30 Years (%)
|
-
|
|
4
|
6.1
|
5.8
|
6.68%
|
|
<20 Years (%)
|
-
|
|
0
|
0
|
1.2
|
0
|
|
Employee Turnover Rate (Resignations) -
Affirmative Action
|
%
|
|
|
1.9
|
1.4
|
1.6
|
1.4
|
|
Engagement Survey Score
|
%
|
|
|
72
|
72
|
72
|
72
|
|
Data coverage of engagement Survey Score
|
% of employees who responded to the survey
|
|
|
81
|
84
|
86
|
86
|
|
Engagement Survey Score - Officers
|
(%)
|
65
|
NA
|
69
|
72
|
72
|
72
|
|
Engagement Survey Score - Non-Officers ***
|
(%)
|
83
|
NA
|
NA
|
-
|
74
|
74
|
|
Engagement Survey for Officers – Gender
|
Male (%)
|
66
|
NA
|
70
|
73
|
73
|
73
|
|
Female(%)
|
61
|
NA
|
60
|
63
|
59
|
59
|
|
Engagement Survey for Officers – Age Group
|
60+ Years (%)
|
86
|
NA
|
-
|
100
|
75
|
75
|
|
51-55 Years (%)
|
80
|
NA
|
86
|
83
|
84
|
84
|
|
56-59 Years (%)
|
85
|
NA
|
86
|
85
|
84
|
84
|
|
46-50 Years (%)
|
75
|
NA
|
81
|
83
|
80
|
80
|
|
41-45 Years (%)
|
70
|
NA
|
78
|
80
|
80
|
80
|
|
36-40 Years (%)
|
66
|
NA
|
68
|
69
|
69
|
69
|
|
31-35 Years (%)
|
55
|
NA
|
61
|
67
|
66
|
66
|
|
26-30 Years (%)
|
49
|
NA
|
51
|
57
|
58
|
58
|
|
18-25 Years (%)
|
53
|
NA
|
51
|
63
|
66
|
66
|
|
Engagement Survey for Non-Officers – Gender
|
Male (%)
|
85
|
-
|
-
|
-
|
75
|
75
|
|
Female(%)
|
86
|
-
|
-
|
-
|
72
|
72
|
|
Engagement Survey for Non-Officers – Age Group
|
60+ Years (%)
|
91
|
-
|
-
|
-
|
N/A
|
N/A
|
|
51-55 Years (%)
|
91
|
-
|
-
|
-
|
85
|
85
|
|
56-59 Years (%)
|
91
|
-
|
-
|
-
|
84
|
84
|
|
46-50 Years (%)
|
89
|
-
|
-
|
-
|
81
|
81
|
|
41-45 Years (%)
|
85
|
-
|
-
|
-
|
76
|
76
|
|
Mean gender pay gap
|
Officers
|
-
|
-
|
-
|
-
|
-
|
8%
|
|
Median gender pay gap
|
-
|
-
|
-
|
-
|
-
|
5%
|
|
Mean bonus pay gap
|
-
|
-
|
-
|
-
|
-
|
23%
|
|
Median bonus pay gap
|
-
|
-
|
-
|
-
|
-
|
26%
|
|
Local EmployeesL share in the workforce
|
%
|
|
|
|
62
|
65
|
66
|
|
Local employees in non-managerial positions
|
%
|
|
|
|
68
|
7
|
72
|
|
Local employees in in all management positions, including junior, middle and senior management
|
%
|
|
|
|
49
|
55
|
55
|
|
Local employees in senior management
|
%
|
|
|
|
31
|
41
|
37
|
|
Executive level (base salary only) - Women
|
In rupess INR
|
|
|
|
|
|
9,493,000
|
|
Executive level (base salary only) - Men
|
In rupess INR
|
|
|
|
|
|
8,840,000
|
|
Executive level (base salary + other cash incentives) - Women
|
In rupess INR
|
|
|
|
|
|
14,533,000
|
|
Executive level (base salary + other cash incentives) - Men
|
In rupess INR
|
|
|
|
|
|
13,798,000
|
|
Management level (base salary only) - Women
|
In rupess INR
|
|
|
|
|
|
1,757,000
|
|
Management level (base salary only) - men
|
In rupess INR
|
|
|
|
|
|
1,844,000
|
|
Management level (base salary + other cash incentives) - Women
|
In rupess INR
|
|
|
|
|
|
2,045,000
|
|
Management level (base salary + other cash incentives) - men
|
In rupess INR
|
|
|
|
|
|
2,190,000
|
|
Non-management level - Women Salary
|
In rupess INR
|
|
|
|
|
|
886,000
|
|
Non-management level - Men Salary
|
In rupess INR
|
|
|
|
|
|
1,110,000
|
|
L Local Employee refers to Odisha and Jharkhand Domicile Employees where we have our mines and steel manufacturing facilities
|
|
|
10As a % of non-managerial workforce only
|
|
|
Long Term Incentive are paid out based on company performance towards achieving long term directional goals of company. As middle and lower management employees do not have as big a role in changing the strategic direction of company, they will have a higher impact on achievement of short term goals of company, rather than the long term strategic goals. Hence, it would be unfair to have part of their salary at risk (variable pay) linked to long term incentives, when they may not have much control on the result.
Hence, Long Term Incentives are limited to Senior Management.
Long Term Incentive
Type of LTIP – Cash Incentive; The company performance considered for LTIP is a weighted average of individual KPIs of SPG matrix.
Performance measurement matrix – The company specific performance to be measured based on the KPIs identified under the Sustainable-Profitable-Growth (SPG) matrix. The achievement of KPIs averaged over the performance period would be used as the overall achievement against target.
Company Performance based multiplier (% to be considered) – Based on the company performance measurement
Individual performance based multiplier
Individual Performance Multiplier – Based on the cumulative performance rating of the individual
- LTIP only for IL2 and above (2.68% of officers)
- LTIP payout after 3 years
- % of officers below Sr. Mgmt level (officers only) = 97% (IL3 and below)
- LTIP is basis SPG Matrix, so yes, sustainability factors such as CSI, Quality Index, Employee Productivity, CO2 emission is considered
|
|
Race, ethnicity, nationality and country of origin is nearly uniform in Tata Steel Limited as our locations based out of India. Hence, our employees are nearly of the same Race, ethnicity, nationality and country of origin. We do report based on cultural background such as Affirmative Action (AA) community related disclosures. AA community includes scheduled castes (Socially disadvantaged community) and scheduled tribe (indigenous peoples).
Some data breakups like Age group, Gender, Management level (e.g. junior/low level, middle, senior/top level management), race, ethnicity, nationality, country of origin, cultural background, etc. may not add up to 100% as they have been rounded off for better comprehension.
|
 Corporate
 Sustainability
 Products & Solutions
 Investors
 Careers
 Contact Us