The following operating and financial review is intended to convey the Management's perspective on the financial and operating performance of the Company at the end of Financial Year 2015-16. This report should be read in conjunction with the Company's financial statements, the schedules and notes thereto and the other information included elsewhere in the Integrated Report. The Company's financial statements have been prepared in compliance with the requirements of the Companies Act, 2013, the guidelines issued by the Securities and Exchange Board of India (SEBI) and the Generally Accepted Accounting Principles (GAAP) in India.
This report is an integral part of the Directors' Report. Aspects on industry structure and developments, opportunities and threats, outlook, risks and concerns, internal control systems and their adequacy, material developments in human resources and industrial relations have been covered in the Directors' Report. Your attention is also drawn to sections titled Risks & Opportunities, Human Capital, Strategy and Resource Allocation forming part of the Integrated Report. These sections give significant details on aspects mentioned above.
1. TATA STEEL INDIA
(₹ crore)
FY 16 |
FY 15 |
|
| Turnover | 38,210 |
41,785 |
| Profit before tax (PBT) | 6,127 |
8,509 |
| Profit after tax (PAT) | 4,901 |
6,439 |
a) Steel Division - Jamshedpur
(i) Operational Performance
During the year, the Company faced significant pressure from Chinese imports. We tried to optimise the production and plant yield through efficient use of resources. The saleable steel production stood at 9.7 million tonnes, as against 9.07 million tonnes in the previous year, an increase of 6.9%.
We implemented best practices in Blast Furnace operations that provided benefits for sustainable improvement. The hot metal production increased by 4.8% over the previous year.
(In million tonnes)
FY 16 |
FY 15 |
FY 15 |
|
| Hot Metal | 10.65 |
10.16 |
4.8 |
| Crude Steel | 9.96 |
9.33 |
6.8 |
| Saleable Steel | 9.70 |
9.07 |
6.9 |
| Sales | 9.54 |
8.75 |
9.0 |
The saleable steel production and sales trend over the years is as follows:
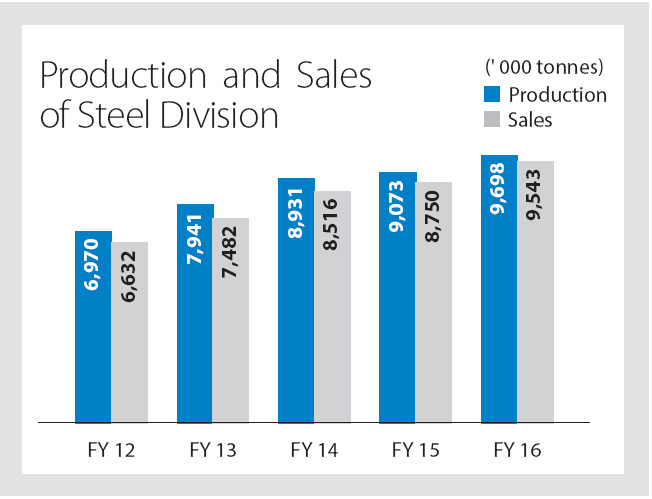
Some of the key factors that resulted in stable performance were consistent supply of desired quality of raw materials from captive mines, low priced and low ash imported coking coal, stable plant operations leading to better plant yield and consistent supply of energy and utilities. Some of the key operational improvements during Financial Year 2015-16 were reduction in the fuel rate at blast furnaces, better solid waste utilisation at sinter plants, hot metal and scrap yield, consumption of lime and ferro alloys at steel making, logistics and energy efficiency.
(ii) Sales Performance
The operations were well supported by the marketing and sales department. During difficult times (steel dumping from China), the marketing and sales teams focused on selling high-end, value products forming a part of the branded and automotive segment, thereby ensuring that realisations were better than the market.
Key Marketing and Sales Initiatives
The key highlights and initiatives undertaken during the year are as below:
1. Automotive and Special Products
Despite marginal growth in the automotive segment, the Company achieved its best ever sales of 1.43 million tonnes, an increase of about 5% over the previous year. This was achieved through various initiatives such as coverage of 7 vehicle models across 3 Original Equipment Manufacturers (OEMs) through Value Analysis & Value Engineering (VAVE) programmes, the development and commercialisation of Cold Roll 590 and the formation of Jamshedpur Continuous Annealing and Processing Company (JCAPCPL). The Company's initiatives have been acknowledged and recognised by customers by way of awards - 'Zero PPM Award by Toyota', 'Overall Excellence Award by Maruti', and 'Overall Performance Award by Tata Motors'.
2. Branded Products, Retail and Solutions
Sales of branded products increased by around 7% compared to the previous year. The Company achieved its highest ever B2C sales of 1.57 million tonnes, including sales of branded products - Tata Tiscon and Tata Shaktee. In the Small & Medium Enterprise (SME) segment, the sales of Hot Roll brand Tata Astrum crossed a million tonnes. Tata Steelium, which serves Cold Roll customers in the SME segment also grew by 8% and recorded its highest ever sales of around 0.6 million tonnes.
3. Industrial Products, Projects and Exports
Continued efforts to increase the Company's value added sales in the Industrial Products vertical were made. This resulted in recording the highest sales in the Liquid Petroleum Gas Cylinder segment. This segment grew by approximately 60% (with a market share of 44%) compared to the previous year. The Company also recorded its initial volumes of approximately 28,000 tonnes in the new segments such as API Pipes (American Petroleum Institute), Lifting & Excavation and Construction & Infrastructure, in preparation of steel from the Kalinganagar steel plant.
In order to move up the value chain and command a premium, the Company continues to focus on the Branded Products, Retail & Solutions. Being the first Company in India to de-commoditise steel and venture into steel branding, we have steadily increased our share of branded products in the Company's overall turnover year-on-year (yoy).
a) Steel Division - Kalinganagar
A state-of-the-art integrated steel plant is being established at Kalinganagar (KLNR) in two modules of 3 million tonnes per annum. The process route for the plant is Basic Oxygen Furnace, Continuous Caster, Hot Strip Mill/Cold Rolling Mill and the product mix would be Hot Rolled Coil, Cold Rolled Closed Annealed Coil and Galvanized Coil.
In the first phase the following facilities are under installation and stabilisation: 3.3 million tonnes per annum capacity of Blast Furnace, two coke ovens - stamp-charged gas recovery type batteries of 1.5 million tonnes per annum of gross coke, Sinter Plant with gross production capacity of 5.75 million tonnes per annum, Steel Melting Shop (SMS) two vessels with a twin strand slab caster and the Hot Strip Mill (HSM) having two roughing mills along with seven strand finishing mill.
The first phase of the project will cover various grades of hot-rolled products of different thicknesses. The finished product of Advanced High Strength Steels (AHSS) of 1800 mm width with tensile strength of 800 MPa (mega pascal) from the facility will address to a great extent the future requirements of auto manufacturers for light weight, higher strength steels while offering much better fuel efficiency.
Few of the highlights of the Plant are as follows:
- Largest operating LD converter in India with 310 tonnes.
- 100% by-product gas-based power generation leading to reduction in carbon footprint.
- Significant reduction of noise and dust pollution during production and Zero-effluent discharge.
- Large operating blast furnaces (4330 m3).
- Twin wagon tipplers for achieving faster turnaround time.
- Designed to have minimal water footprint.
New technologies like Granshot Systems have also been introduced to granulate hot metal in an eco-friendly manner while balancing hot metal production and consumption mismatch. Similarly, Composition Adjustment System with Oxygen Blowing has been introduced in the steelmaking for improved steelmaking. The plant is provided with Waste Recycling Plant and Central Effluent Treatment Plant to conserve natural resources.
The Company has developed a comprehensive rehabilitation and resettlement package for the relocated families. Details of this can be found in the Social Capital section of this Integrated Report.
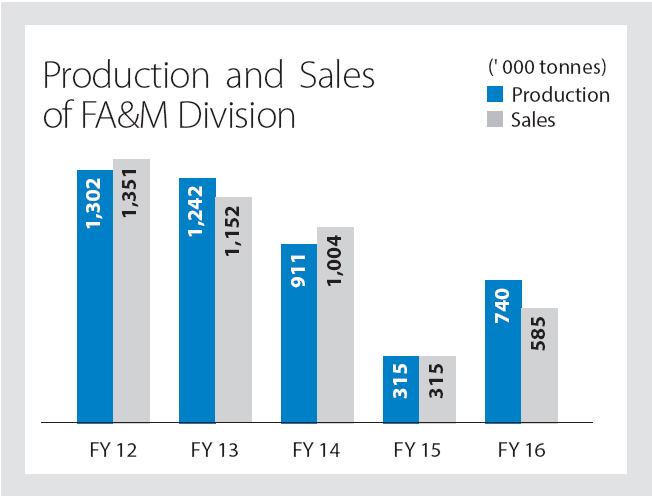
b) Ferro Alloys and Minerals Division
The Company's Ferro Alloys & Minerals Division (FAMD) is the market leader in Ferro Chrome in India and is amongst the top six chrome alloy producers in the world, with operations spanning across two continents. It is also the leading Manganese Alloy producer in India.
During the year, the Government of Odisha permitted conversion of ferro chrome through external business partners. This led to increase in operations at FAMD.
FAMD achieved a production of 740 KMT against 315 KMT in the previous year. Operations in the previous year were severely affected due to closure of mines for a significant part of the year.
The Company's Sukinda Chromite Mine was awarded the "Sustainable Development Framework Award" by the Ministry of Mines, Government of India and Indian Bureau of Mines. This is the first mine in India to have won such an award.
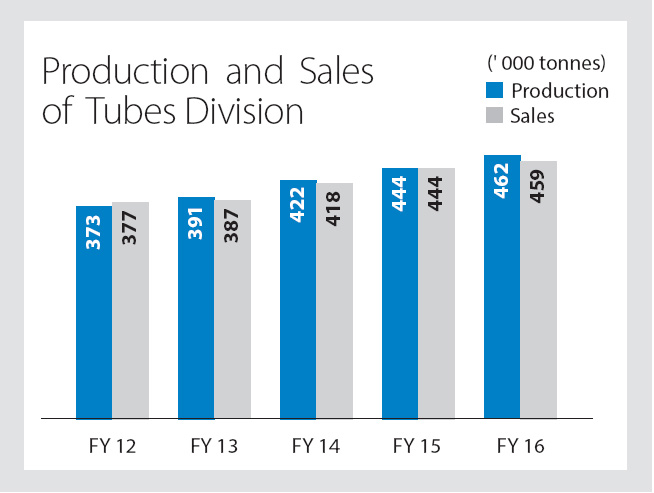
c) Tubes Division
The Tubes SBU today is the largest manufacturer of a variety of steel tubes in India. The tubes main works is situated at Jamshedpur and its three main lines of business are commercial tubes for the conveyance segments (Tata Pipes), structural tubes for the construction segment (Tata Structura) and precision tubes for the auto, boiler and engineering segments.
During Financial Year 2015-16, the division focused on new business areas like services and solutions, pre-fabricated steel, general engineering and fire resistant, etc., which led to steady growth of 4% despite falling steel prices. The Division has also undertaken measures to rationalise its operating parameters such as yield improvements in mills, engaging with external business partners to contain the production cost.
Significant operational highlights of the Division were:
- Completed 564 days without Loss Time Injuries (LTI).
- Tata Structura achieved highest-ever annual sales of 1,98,175 metric tonnes (Previous best 1,75,591 metric tonnes) registering a growth of 13% over Financial Year 2014-15.
- Two innovative products were launched at the 10th
Anniversary celebration of Tata Structura Brand.
- High strength variant of 355 MPA steel hollow sections called Tata Structura 355, which has enhanced yield strength enabling additional weight saving of 10-15% to customers.
- Tata Structura added an additional variant with "Fire-resistance properties".
d) Bearings Division
The Company's Bearings Division is one of India's largest quality bearing manufacturers, with an annual production capacity of 37 million bearing numbers. It is the only bearings manufacturer in India to win the TPM Award (2004) from Japan Institute of Plant Maintenance, Tokyo. The Company is foremost in the manufacturing of a wide variety of bearings and auto assemblies and the product range includes Bearings & Auto Assemblies Components, Ball Bearings, Tapered Roller Bearings, Magneto Bearings, Clutch Release Assemblies, Fan Support Assemblies and Cylindrical Roller Bearings.
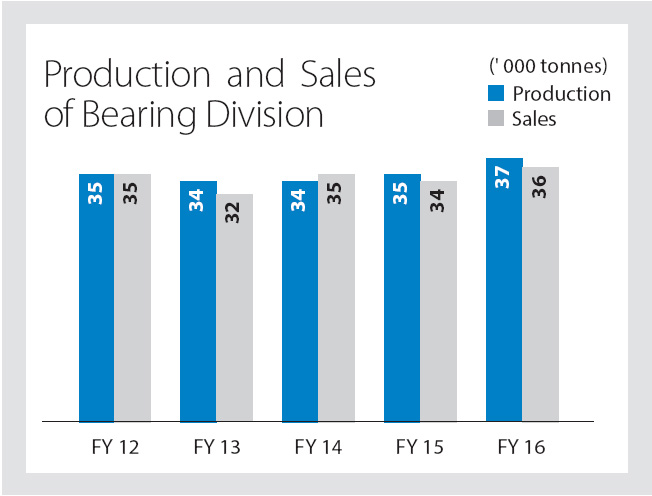
The division recorded a sales growth of 6% y-o-y mainly due to increased off-take by auto OEM customers. The Division has also improved plant efficiency by de-bottlenecking and leveraging its existing resources for sustainable operations.
The Division continues to maintain its position as a preferred supplier amongst its key customers and was recognized through number of awards and accolades - Quality Gold Award from Bajaj Auto for quality, cost and delivery besides consistent 'Zero PPM' certificates from various other keys customers.
2. TATA STEEL EUROPE
Tata Steel Europe (TSE) produces carbon steel by the basic oxygen steelmaking method at two integrated steelworks in the UK (Port Talbot and Scunthorpe), and in the Netherlands (IJmuiden). Speciality steel and bar products are produced in the UK at Rotherham using the electric arc furnace method. During the year, TSE produced 14.5 million tonnes of steel products (15.2 million tonnes in the previous year). The production decline of 4% was mainly due to the restructuring measures implemented in the UK i.e. to reduce production levels, rationalise costs and focus on businesses with higher margins.
TSE has been adversely affected by the cyclical nature of the steel industry, general economic conditions and increased competition within the Europe and around the world. In 2015, Europe became a net importer of steel for the first time since 2008. The net import was 4 metric tonnes in 2015, with imports of 38 metric tonnes exceeding exports of 34 metric tonnes. Exports from China were at a record high at 112 metric tonnes.
Following the financial crisis of 2008, the global steel demand, particularly in developed markets like Europe remained muted. The recent deterioration of the trading conditions in UK and Europe due to structural factors including global oversupply of steel, increasing third country exports into Europe, continued weakness in steel demand in the domestic market, volatile currency and high manufacturing cost which is forecasted to continue in future, led to review of the European Operations. An independent, internationally reputed consultant was appointed to submit the restructuring plan. The Board of Tata Steel Limited, at its meeting held on March 29, 2016 reviewed and advised the Board of TSE to explore all options for a portfolio restructuring of its European business including the potential divestment of its subsidiary Tata Steel UK Limited (TSUK), in whole or in parts, in a time bound manner.
The current general economic conditions in Europe coupled with the continued under performance triggered a year-end impairment assessment in TSE for the purposes of its March 31, 2016 year end reporting. Accordingly, a non-cash impairment charge of ₹8,171 crore has been recognised in TSE primarily relating to TSUK.
Further during the year, a formal consultation has been completed with the employees with respect to changes in the British Steel Pension Scheme (BSPS) and triennial valuation resulting in a net gain of £872 mn (₹8,589 crore). In relation to the Stichting Pensioenfonds Hoogovens (SPH) scheme, an agreement has been entered into between Tata Steel Nederland BV and the SPH Board that allows the scheme to be classified as a defined contribution scheme rather than defined benefit scheme resulting in a net gain of £113 mn (₹1,113 crore).
The turnover and profit/loss figures of TSE are given below:
(₹ crore)
FY 16 |
FY 15 |
|
| Turnover | 67,402 | 79,878 |
| Profit before tax (PBT) | (7,621) | 6,649) |
| Profit after tax (PAT) | (7,627) | (6,724) |
PAT includes PAT after minority interest and share of profit of associates.
The production and sales performance of TSE is given below:
(In million tonnes)
FY 16 |
FY 15 |
change (%) |
|
| Liquid steel production | 14.5 |
15.2 |
(4) |
| Deliveries | 13.6 |
13.7 |
- |
TSE's revenue of ₹ 67,402 crore for Financial Year 2015-16 was 16% lower than the previous year. The average revenue per tonne declined by 14% in comparison to the previous year due to weak market conditions. TSE's loss before tax for Financial Year 2015-16 widened over the previous year primarily due to decline in operating profits.
The main operational issues during Financial Year 2015-16 included the following:
• Port Talbot – In August 2015, TSE announced restructuring plans to concentrate UK production of hot rolled coil at its Hot Strip Mill in Port Talbot and until market conditions become more favourable, mothball some of its coil processing facilities, including the sibling hot strip mill at Llanwern, Newport. Liquid steel production in Financial Year 2015-16 at 4 million tonnes was 0.6 million tonnes lower than the previous year due to the impact of the above restructuring. Performance in Financial Year 2015-16 included improved downstream performance in the Port Talbot Hot Mill following the replacement of the rougher in 2015 and efficiency improvements in the heavy end operations which contributed to record performance levels in the liquid phase.
• Scunthorpe – In October 2015, TSE announced restructuring plans to stop production of steel plate in its Long Products business. Plate mills in Scunthorpe, Dalzell and Clydebridge were mothballed while one of the two coke ovens at the Scunthorpe steelworks was closed. Liquid steel production in Financial Year 2015-16 at 2.97 million tonnes remained broadly unchanged from the previous year.
• IJmuiden (Strip MLE) – Liquid steel production in Financial Year 2015-16 at 7.14 million tonnes was 0.14 million tonnes higher than the previous year. At 5.27 million tonnes, the Hot Strip Mill achieved its best ever output, improving the record of last year (5.22 million tonnes). The Direct Sheet Plant produced its best ever output of 1.33 million tonnes, improving its record of last year (1.21 million tonnes). The Hot Dip Galvanized 1 line set a new yearly production record of 0.40 million tonnes, marginally higher than the previous year.
During the year, TSE registered many customer successes in the form of awards and recognitions such as winning two of the seven Steelie awards during a ceremony at the 49th World Steel Conference in Chicago for Excellence in Life, Cycle Assessment and Excellence in Education and Training.
3. NATSTEEL HOLDINGS (NSH)
The turnover and profit/loss figures of NatSteel Holdings (NSH) for Financial Year 2015-16 are as follows:
(₹ crore)
FY 16 |
FY 15 |
|
| Turnover | 4,697 |
9,028 |
| Profit before tax (PBT) | (283) |
(817) |
| Profit after tax (PAT) | (233) |
(812) |
PAT includes PAT after minority interest and share of profit of associates.
During Financial Year 2015-16, NSH recorded total deliveries of 1.55 million tonnes as against 2.46 million tonnes in the previous year. The lower deliveries were attributable to lower production as NSH mothballed its operations in China from the second half of Financial Year 2015-16. The continuous influx of cheap imported bars from China and fierce competition had caused domestic bar price to be amongst one of the lowest in the Asian region. The loss in NSH's operations decreased owing to decline in input prices and various other cost saving initiatives at its Singapore operations. Further, mothballing of Xiamen operations had also saved cost and reduced losses.
During the year, NSH's Vietnam and Malaysian operations achieved all-time high sales of downstream at 28k tonnes. It has now become a key market for NSH. Also, NSH entered into a joint venture and installed a Cut and Bend Bar plant of 100k tonnes capacity in Hong Kong.
NSH Singapore received "2015 World Steel Safety and Health Excellence Recognition" award acknowledging the efforts put into the "Total Workplace Safety and Health" programme.
4. TATA STEEL THAILAND
The turnover and profit/loss figures of Tata Steel Thailand (TSTH) for Financial Year 2015-16 are as follows:
(₹ crore)
FY 16 |
FY 15 |
|
| Turnover | 3,154 |
4,020 |
| Profit before tax (PBT) | 39 |
(74) |
| Profit after tax (PAT) | 26 |
(79) |
PAT includes PAT after minority interest and share of profit of associates.
Thailand recorded a growth of 2.8% as against 0.9% the previous year. Increased allocation towards infrastructure projects by the Government and other various incentives from the Board of Investment provided the much needed boost for non-durable consumption and increased customer confidence.
Developments in second half of Financial Year 2015-16, created an unexpected upswing in the iron ore and scrap prices resulting in market volatility with very frequent price changes of products. TSTH sales volume stood at 1,145k tonnes, an increase of 2% over the previous year. The uptick was on account of increased demand from the Infrastructure segment and neighbouring countries. The turnover witnessed a decline by 22% primarily due to fall in commodity prices and availability of cheap Chinese imports. However, the increased profits can be attributed to TSTH's continued focus towards better operational and commercial excellence. The production declined by 193k tonnes as low priced imported billets were available in the market. In addition, to address volatility in the market place, TSTH stayed focused on reduction in conversion cost, fixed cost and optimising its working capital, finishing the year better than planned, in these areas. TSTH reduced its long-term debt by 865 million Baht.
During the year the NTS Plant of TSTH won the Prime Minister's Industrial Award in Quality Management and SCSC of TSTH received the "Green Mining Award 2015" from the Department of Primary Industries and Mines.
5. TATA METALIKS LIMITED
The turnover and profit/loss figures of Tata Metaliks Limited (TML) for Financial Year 2015-16 are as follows:
(₹ crore)
FY 16 |
FY 15 |
|
| Turnover | 1,302 |
1,419 |
| Profit before tax (PBT) | 148 |
132 |
| Profit after tax (PAT) | 122 |
109 |
PAT includes PAT after minority interest and share of profit of associates.
TML is one of the leading manufacturers of foundry grade Pig Iron in India with a capacity of 4,00,000 tonnes per annum at its plant at Kharagpur in West Bengal. Tata Metaliks DI Pipes Limited (TMDIPL), also located at Kharagpur, engaged in the manufacturing of Ductile Iron Pipes with a capacity of 1,28,000 tonnes per annum, is a 100% subsidiary of TML.
During the year, TML has surpassed its previous best hot metal production at 4,33,000 tonnes with continuous improvement in coke rate and sinter production, which are also the best ever. The production and sale of ductile iron pipes increased by 20% and 18% respectively as compared to the previous year. The annual profits of the current year are higher than that of the previous year primarily due to lower input cost, owing to favourable usage and lower cost of raw materials - coke and iron ore. TML has achieved its best ever annual profit consecutively for two years in a row due to the significant improvements in its operating parameters.
TML is striving for long-term sustainability through cost reduction projects like the 1,20,000 tonnes per annum coke oven plant on BOOT (Built, Operate, Own, Transfer) along with a 10 MW waste heat recovery captive power plant and growth projects like increasing blast furnace volume from 225 m3 to 305 m3 and enhancing DI pipe plant capacity to 1,80,000 tonnes per annum.
6. THE TINPLATE COMPANY OF INDIA LIMITED
The turnover and profit/loss figures of The Tinplate Company of India Limited (TCIL) for Financial Year 2015-16 are as follows:
(₹ crore)
FY 16 |
FY 15 |
|
| Turnover | 850 |
935 |
| Profit before tax (PBT) | 113 |
68 |
| Profit after tax (PAT) | 73 |
45 |
TCIL is the largest indigenous producer of tin-coated and tin-free steel used for metal packaging. TCIL has also been 'value-adding' its products by way of providing printing and lacquering facility to reach closer to food processors / fillers. TCIL presently has two Cold Rolling Mills and two electrolytic tinning lines. The installed production capacity of tinplate and tin-free steel is around 3,80,000 tonnes per annum.
During the year, the overall production from the two cold rolling mills was at 3,23,000 tonnes, marginally lower than the previous year (3,27,000 tonnes). The tinning lines production at 3,14,000 tonnes during the current year was 2% lower than the previous year (3,19,000 tonnes). The production performance was affected by lower equipment uptime. The turnover for Financial Year 2015-16 was affected by lower export volumes due to sharp decline in international prices, partly offset by higher domestic volumes. The annual profit of current year is higher as compared to previous year primarily due to lower input raw material cost (decline in prices of hot rolled coils) and tin cost in view of drop in commodity prices.
7. TATA STEEL PROCESSING AND DISTRIBUTION LIMITED
The turnover and profit/loss figures of Tata Steel Processing and Distribution Limited (TSPDL) for Financial Year 2015-16 are as follows:
(₹ crore)
FY 16 |
FY 15 |
|
| Turnover | 1,937 |
2,045 |
| Profit before tax (PBT) | 73 |
41 |
| Profit after tax (PAT) | 49 |
25 |
TSPDL is the largest steel service centre in India with a steel processing capacity of around 1.80 metric tonnes per annum. It has 10 steel processing units, several distribution locations and a host of partners like external processing agencies.
TSPDL has sustained its strong growth path with its commitment to quality processing, innovation and focus on value added services to its customers. TSPDL has an advanced state-of-the-art Plate processing and Fabrication centre in Tada at Andhra Pradesh. It aims to cater the specialised demand from various emerging engineering segments of the industry such as Lifting & Excavating, Power Equipment, Wind Energy, Ship Building, Mining Machinery, Material Handling Equipment, Boiler & Steam generating plant, and so on. The service centre is equipped with high end machines for Cutting, Bending, Welding, Shot Blasting, Machining and Painting.
During the year the turnover was lower than previous year due to lower realisation from the distribution business.
8. TM INTERNATIONAL LOGISTICS LIMITED
The turnover and profit/loss figures of TM International Logistics Limited (TMILL) for Financial Year 2015-16 are as follows:
(₹ crore)
FY 16 |
FY 15 |
|
| Turnover | 563 |
843 |
| Profit before tax (PBT) | 60 |
62 |
| Profit after tax (PAT) | 41 |
42 |
TMILL and its subsidiaries offer logistic services spanning port-based services, shipping, freight forwarding, warehousing and marine services.
During Financial Year 2015-16, TMILL handled all-time record volumes of 1.35 million tonnes. The slowdown in the Global Shipping Market posed a tremendous challenge to the Shipping and Freight Forwarding (FF) divisions and that resulted in a 33% lower turnover in the current Financial Year compared to the previous year. The Company has managed to maintain the profit by restricting exposure in Shipping and FF businesses. The Company has been engaged in cost-control and cost reduction measures.
TMILL has undertaken various growth projects and initiatives like Special Freight Train Operation (SFTO) with wagons taken on lease, to carry Tata Steel's steel cargo. TMILL will also invest in the newly designed wagons for this operation, once the commercial manufacturing starts.
9. TATA BLUESCOPE STEEL LIMITED
The turnover and profit/loss figures of Tata BlueScope Steel Limited (TBSSL) for Financial Year 2015-16 are as follows:
(₹ crore)
FY 16 |
FY 15 |
|
| Turnover | 1,570 |
1,544 |
| Profit before tax (PBT) | 40 |
(48) |
| Profit after tax (PAT) | 38 |
(48) |
TBSSL is a 50:50 joint venture between Tata Steel and BlueScope Steel. TBSSL operates in the SAARC region in the fields of coated steel, steel building solutions and related building products. TBSSL has a state-of-the-art coated steel manufacturing plant at Jamshedpur with a metal coating capacity of 2,50,000 tonnes per annum and a paint line capacity of 1,50,000 tonnes per annum. It manufactures and supplies 55% Al-Zn Alloy coated ZINCALUME® steel and prepainted COLORBOND® steel for the building and construction industry.
During the Financial Year, TBSSL achieved its highest ever profit driven by improved volumes and better margins on account of reduction in input steel cost.
10. TATA SPONGE IRON LIMITED
The turnover and profit/loss figures of Tata Sponge Iron Limited (TSIL) for Financial Year 2015-16 are as follows:
(₹ crore)
FY 16 |
FY 15 |
|
| Turnover | 575 |
807 |
| Profit before tax (PBT) | 42 |
137 |
| Profit after tax (PAT) | 31 |
92 |
TSIL is a manufacturer of sponge iron with 3.9 lakh tonnes per annum and generates 26 MW of power as a byproduct.
During the financial year, TSIL reported lower turnover due to lower realisation owing to unprecedented (32%) drop in annual average price. The drop in iron ore prices has been lower than that of sponge iron, thereby impacting the industry profitability. The announcement of Minimum Import Price is likely to improve the demand for sponge iron.
11. TATA NYK SHIPPING PTE LTD.
The turnover and profit/loss figures of Tata NYK Shipping Pte Limited (TNYK) for Financial Year 2015-16 are as follows:
(₹ crore)
FY 16 |
FY 15 |
|
| Turnover | 1,438 |
1,444 |
| Profit before tax (PBT) | (65) |
(76) |
| Profit after tax (PAT) | (65) |
(76) |
Tata NYK Shipping Pte Ltd., a 50:50 joint venture between Tata Steel and NYK Line, a Japanese shipping major was incorporated to cater to the growing sea-borne trade for the Tata Group and the Indian markets. TNYK currently has a total fleet of 18 vessels comprising six Supramaxes (four owned and two bareboat charters), five Panamaxes (one owned) and seven Capes.
Currently, the dry bulk industry is passing through a downturn caused by reduction in global growth, fall in oil and other commodity prices which led to continuous oversupply of vessels. Accordingly, during the year, turnover of TNYK marginally declined, while the loss has reduced over the previous year due to lower operating cost and decrease in charter hire charges.
TNYK has completed re-certification in audits for ISO 9001:2008 and ISO 14001:2004 under Quality Management System. TNYK also maintains world-class safety standards in ship operations and asset preservation by obtaining zero deficiencies from Worldwide Port State Control & Regulatory Authorities for all of its owned vessels.
During the Financial Year 2015-16, the Company recorded a profit after tax of ₹4,901 crore as compared to ₹6,439 crore in Financial Year 2014-15. The decline is primarily due to lower realisations owing to availability of cheaper steel imports. For the year, there was also an exceptional loss of ₹1,583 crore (Profit of ₹1,891 crore during the previous year). The basic and diluted earnings per share were at ₹ 48.67 (previous year: ₹ 64.49).
The analysis of major items of the financial statements is given below:
a) Net sales and other operating income
(₹ crore)
FY 16 |
FY 15 |
change (%) |
|
| Sale of products | 40,689 |
45,008 |
(10) |
| Sale of power and water | 1,468 |
1,119 |
31 |
| Income from town, medical and other services | 133 |
99 |
33 |
| Other operating income | 396 |
351 |
13 |
| Sales and other operating income | 42,686 |
46,577 |
(8) |
| Less: Excise Duty | 4,476 |
4,792 |
(7) |
| Net sales and other operating income | 38,210 |
41,785 |
(9) |
Overall turnover was lower during the Financial Year 2015-16 as compared to the previous year. The volume increased by 9% as compared to last year, which was offset by lower realisations attributable to adverse market conditions and cheap Chinese imports. FAMD registered higher volumes, as the previous year was impacted by closure of mines and change in mines lease policy by the Government of Odisha.
Division-wise net sales are shown below:
(₹ crore)
| Net Sales | FY 16 |
FY 15 |
change (%) |
| Steel | 34,807 |
38,586 |
(10) |
| Tubes | 1,907 |
2,167 |
(12) |
| Ferro Alloys and Minerals | 1,334 |
875 |
52 |
| Bearings | 162 |
157 |
3 |
| Total | 38,210 |
41,785 |
(9) |
b) Purchase of finished, semi-finished steel and other products
(₹ crore)
| Net Sales | FY 16 |
FY 15 |
change (%) |
| Purchase of finished, semi-finished steel and other products | 992 |
688 |
44 |
Purchase of finished and semi-finished materials increased over Financial Year 2014-15 due to higher purchases of steel wire rods and imported rebars for resale.
c) Raw materials consumed
(₹ crore)
FY 16 |
FY 15 |
change (%) |
|
| Raw Materials consumed | 9,700 |
11,679 |
(17) |
Raw Materials consumed decreased primarily due to lower consumption of purchased iron ore and pellets. Financial Year 2015-16 also saw lower consumption of imported coal and purchased coke.
d) Employee benefits expense
(₹ crore)
FY 16 |
FY 15 |
change (%) |
|
| Payments to and provisions for employees | 4,325 |
4,602 |
(6) |
The Employee benefits expense in the current period decreased over Financial Year 2014-15 primarily on account of decrease in the actuarial estimates owing to change in discounting rates. The decrease was partly offset by normal salary revisions and its consequential impact on the retirement provisions.
e) Stores and spares consumed
(₹ crore)
FY 16 |
FY 15 |
change (%) |
|
| Stores consumed | 2,425 |
2,305 |
5 |
Stores and spares consumed increased over Financial Year 2014-15 primarily on account of increased cost of consumption of industrial gases along with higher consumption at FAMD owing to operations being resumed.
f ) Repairs to machinery
(₹ crore)
FY 16 |
FY 15 |
change (%) |
|
| Repairs to Machinery | 2,025 |
1,864 |
9 |
Repairs to machinery increased over Financial Year 2014-15 mainly on account of higher civil and mechanical jobs at mines and collieries. Further, higher maintenance expenses relating to power distribution system also contributed towards the increase.
g) Conversion charges
(₹ crore)
FY 16 |
FY 15 |
change (%) |
|
| Conversion charges | 2,204 |
1,886 |
17 |
Higher conversion charges are primarily on account of higher cost at FAMD as Financial Year 2014-15 was impacted by temporary closure of mines. Further, increased conversion cost and volumes of Flat Products also contributed towards the increase.
h) Purchase of power
(₹ crore)
FY 16 |
FY 15 |
change (%) |
|
| Purchase of power | 2,743 |
2,570 |
7 |
Power purchased cost increased over Financial Year 2014-15 reflecting increased consumption at Jamshedpur Works and higher purchases for sale through the power distribution business. Also, increased operations at FAMD contributed towards the increase.
i) Freight and handling charges
(₹ crore)
FY 16 |
FY 15 |
change (%) |
|
| Freight and handling charges | 2,995 |
2,883 |
4 |
The freight and handling charges were higher mainly on account of increase in volumes, increase in rail freight and increased volumes at FAMD.
j) Royalty
(₹ crore)
FY 16 |
FY 15 |
change (%) |
|
| Royalty | 939 |
807 |
16 |
Increase in royalty was primarily due to higher volumes of iron ore and increased conversion volumes at FAMD over Financial Year 2014-15 owing to resuming work in the mines after temporary closure last year.
k) Rates and Taxes
(₹ crore)
FY 16 |
FY 15 |
change (%) |
|
| Rates & Taxes | 753 |
685 |
10 |
Rates and taxes were higher over Financial year 2014-15 primarily on account of provision towards contribution to Water Conservation Fund, increase in clean energy cess and charge on account of amendment in Jharkhand VAT restricting the input tax credit to raw materials. The increase was partly offset by the reduction in the provisions made towards DMF (District Mineral Foundation) post notification in September 2015 stipulating the rate to 30%. The provision was considered at 100% of the royalty.
l) Other expenses
(₹ crore)
FY 16 |
FY 15 |
change (%) |
|
| Other expenses | 1,827 |
2,420 |
(25) |
Other expenses decreased as Financial Year 2014-15 included one time provision taken on account of de-allocation of Kotre Basantpur and Ganeshpur coal block, not present during current year. Further, lower foreign exchange loss on revaluation of current liabilities and loans also contributed towards decrease.
m) Finance costs and Net Finance cost
(₹ crore)
FY 16 |
FY 15 |
change (%) |
|
| Finance costs | 1,460 |
1,976 |
(26) |
| Net Finance charges | 1,253 |
1,487 |
(16) |
Finance costs were lower than Financial Year 2014-15 primarily due to lower interest cost on account of repayment of FCCB bonds, other term loans and non-convertible debentures as well as higher interest capitalisation in relation to Kalinganagar Project.
Net finance charges were lower in line with lower finance cost partly offset by lower profits from sale of mutual funds.
n) Exceptional items
(₹ crore)
FY 16 |
FY 15 |
change (%) |
|
| Exceptional Items | (1,583) |
1,891 |
(184) |
The exceptional items in Financial Year 2015-16 primarily represents royalty charge on clean coal, Middlings and Tailings (₹880 crore), write down of investments in Tayo, Tata Teleservices Ltd. and Chhattisgarh (₹199 crore) and impairment of Assets at Malda mines (₹42 crore). Further, additional charge on account of Employee Separation Scheme under Sunhere Bhavishya ki Yojana scheme (₹556 crore) also contributed towards the charge. These exceptional charges were partly offset by profit on divestments in Tata Projects and TRF (₹106 crore).
The exceptional items in Financial Year 2014-15 represents profit on sale of investment in The Dhamra Port Company Limited (DPCL) (₹788 crore), profit on sale of land at Borivali (₹1,147 crore). Further, additional provision on account of diminution in value of investments were taken for Tayo (₹166 crore) partly offset by profit on divestment in Lanka Special Steels Limited (₹18 crore) and reversal of impairment charge earlier taken for Gopalpur (₹136 crore).
o) Fixed assets
(₹ crore)
FY 16 |
FY 15 |
change (%) |
|
| Tangible Assets | 24,902 |
25,071 |
(1) |
| Capital Work-in- Progress | 26,954 |
23,024 |
17 |
| Other Intangible Assets | 527 |
177 |
198 |
| Intangible Asset Under Development | 28 |
13 |
118 |
| Net Block | 52,411 |
48,285 |
9 |
The increase in fixed assets represents primarily capital expenditures towards Kalinganagar project in Odisha.
p) Investments
(₹ crore)
FY 16 |
FY 15 |
change (%) |
|
| Trade investments | 2,210 |
2,168 |
2 |
| Investment in Subsidiary, JVs and Associates | 50,150 |
49,996 |
- |
| Other Investments | 4,321 |
1,000 |
- |
| Total investments | 56,681 |
53,164 |
7 |
The increase in Other Investment was predominantly on account of higher investments in Mutual Funds over Financial Year 2014-15.
q) Inventories
(₹ crore)
FY 16 |
FY 15 |
change (%) |
|
| Stores & Spares | 1,888 |
1,807 |
5 |
| Stock in trade | 5,196 |
6,235 |
(17) |
| Total inventories | 7,084 |
8,042 |
(12) |
Increase in stores and spares were primarily at Kalinganagar plant. Finished and semi-finished inventory has gone down by ₹ 143 crore as compared to March 31, 2015. Raw material inventories have decreased over March 2015 by ₹ 897 crore mainly due to decrease in stock of purchased iron ore and coal.
r) Sundry Debtors
(₹ crore)
FY 16 |
FY 15 |
change (%) |
|
| Gross Debtors | 647 |
508 |
27 |
| Less: provision for doubtful debts | 14 |
17 |
(16) |
| Net Debtors | 633 |
491 |
29 |
Increase in debtors is primarily due to higher sales as compared to Financial Year 2014-15.
s) Loans and advances
(₹ crore)
FY 16 |
FY 15 |
change (%) |
|
| Loans and advances | 5,031 |
5,135 |
(2) |
Decrease in Loans and Advances is primarily on account of reduction in derivative assets owing to repayment of US$ 335 Mn loan in the Financial Year 2015-16.
t) Cash flow and Net debt Cash flow
(₹ crore)
FY 16 |
FY 15 |
|
| Net Cash flow from operating activities |
7,568 | 4,852 |
| Net Cash flow from investing activities |
(5,405) | (2,382) |
| Net Cash flow from financing activities |
(1,631) | (2,957) |
| Net increase /(decrease) in cash & cash equivalents |
531 | (487) |
Net cash flow from operating activities
The net cash from operating activities was ₹7,568 crore during Financial Year 2015-16 as compared to ₹4,852 crore during Financial Year 2014-15. The cash operating profit before working capital changes and direct taxes during Financial Year 2015-16 was ₹7,230 crore as compared to ₹10,658 crore during Financial Year 2014-15 due to lower profitability. Working Capital decreased in Financial Year 2015-16 by ₹1,582 crore due to decrease in Trade and other receivables by ₹38 crore and inventories by ₹960 crore respectively. Further increase in Trade payables and other liabilities by ₹584 crore contributed to the decline. The income taxes paid during Financial Year 2015-16 were ₹1,244 crore as compared to ₹2,053 crore during Financial Year 2014-15.
Net cash from investing activities
The net cash outflow from investing activities amounted to ₹5,405 crore in Financial Year 2015-16 as compared to an outflow of ₹2,382 crore during Financial Year 2014-15. The outflow during Financial Year 2015-16 was broadly capex (₹5,828 crore), purchase (net of sale) of current investment (₹3,140 crore) and purchase of shares in Tata Motors (₹376 crore). The outflow was partly offset by sale proceeds from sale of Tata Motors, Titan and Tata Projects (₹3,976 crore).
Net cash from financing activities
The net cash outflow from financing activities was ₹1,631 crore during Financial Year 2015-16 as compared to an outflow of ₹2,957 crore during Financial Year 2014-15. The outflows during the current period were mainly interest payments (₹1,585 crore), dividend paid (₹926 crore) along with repayment of loans (₹7,755 crore). These outflows were partly offset by borrowings of commercial paper (₹3,233 crore), SBI (₹2,000 crore) and term loans (₹3,500 crore).
Net Debt
(₹ crore)
FY 16 |
FY 15 |
|
| Gross Debts | 29,643 |
28,198 |
| Less: Cash and Bank balances | 1,050 |
516 |
| Less: Current investments | 4,320 |
1,000 |
| Net Debt | 24,273 |
26,682 |
Net debt as on March 31, 2016 was ₹24,273 crore as compared to ₹26,682 crore as on March 31, 2015.
During the current year gross debt increased primarily due to following:
- Increase borrowings of commercial paper (₹3,235 crore), SBI (₹2,000 crore) and term loans (₹3,500 crore) partly offset by,
- Repayment of US$ 335 Mn (₹2,094 crore), GBP 100 Mn (₹993 crore), EUR 264 Mn (₹135 crore), NCD (₹1,037 crore), SBI (₹1,000 crore) and term loans (₹1,500 crore).
Further Current investments, Cash and Bank balances were higher by ₹3,856 crore as compared to March 31, 2015 resulting in the decrease in the net debts.
2. TATA STEEL GROUP
Tata Steel Group posted a consolidated loss after tax (after minority interest and share of profit of associates) of ₹ 3,049 crore against a loss of ₹ 3,926 crore in the previous year. Financial Year 2015-16 also includes an exceptional charge of ₹ 3,975 crore.
a) Net sales and other operating income
(₹ crore)
March 31,
2016 |
March 31,
2015 |
change (%) |
|
| Tata Steel | 38,210 |
41,785 |
(9) |
| TSE | 67,402 |
79,878 |
(16) |
| NSH | 4,697 |
9,028 |
(48) |
| TSTH | 3,154 |
4,020 |
(22) |
| Others | 24,427 |
32,314 |
(24) |
| Eliminations & Adjustments | (20,738) |
(27,521) |
(25) |
| Group Total | 1,17,152 |
1,39,504 |
(16) |
Turnover of the Group during the current year was lower as compared to Financial Year 2014-15. Decrease at Tata Steel India was primarily on account of lower domestic realisation attributable to adverse market conditions partly offset by higher sales at Ferro Alloys and Mineral Division (FAMD). The turnover of TSE was lower than the previous year mainly on account of decrease in realisations due to weak market conditions. Turnover of NSH decreased by 48% primarily on account of declining steel prices and weak market conditions. Further, disposal of Australian operations and mothballing of China operations contributed to the decline. TSTH reported a decrease mainly on account of lower realizations.
b) Purchase of finished, semi-finished and other products
(₹ crore)
March 31,
2016 |
March 31,
2015 |
change (%) |
|
| Tata Steel | 992 |
688 |
44 |
| TSE | 5,108 |
4,180 |
22 |
| NSH | 2,664 |
6,738 |
(60) |
| TSTH | 1,680 |
2,438 |
(31) |
| Others | 2,663 |
3,368 |
(21) |
| Eliminations & Adjustments | (2,933) |
(3,608) |
(19) |
| Group Total | 10,174 |
13,804 |
(26) |
Purchases at the Indian operations increased primarily on account of higher purchases of imported rebars and wire rods. At TSE the increase has been primarily due to external steel purchases required for operation. Decrease at NSH is in line with lower sales volume.
c) Raw materials consumed
(₹ crore)
March 31,
2016 |
March 31,
2015 |
change (%) |
|
| Tata Steel | 9,700 |
11,679 |
(17) |
| TSE | 21,465 |
27,542 |
(2) |
| NSH | 73 |
82 |
(1) |
| TSTH | 220 |
181 |
22 |
| Others | 15,134 |
21,679 |
(30) |
| Eliminations & Adjustments | (14,404) |
(20,422) |
(29) |
| Group Total | 32,188 |
40,741 |
(21) |
The decrease at Tata Steel India reflects lower consumption of purchased iron ore and pellets as previous year was impacted on account of temporary closure of mines. Further, lower consumption of imported coal and coke resulted in lower costs in India. Decrease at TSE is primarily due to the drop in iron ore and coking coal costs. Others primarily reflect activities at TSGP in relation to raw material procurement, eliminated on consolidation.
d) Employee benefits expense
(₹ crore)
March 31,
2016 |
March 31,
2015 |
change (%) |
|
| Tata Steel | 4,325 |
4,602 |
(6) |
| TSE | 14,003 |
15,052 |
(7) |
| NSH | 544 |
685 |
(21) |
| TSTH | 152 |
147 |
3 |
| Others | 943 |
922 |
2 |
| Group Total | 19,967 |
21,408 |
(7) |
Employee Benefit expenses decreased in Tata Steel India as previous year included charge on account of change in actuarial estimates due to the change in discounting rates partly offset by increase in normal salary revisions and its consequential impact on the retirement provisions. The wage cost at TSE was lower as a result of reduction in headcount of approximately 2,000 people along with its retirement provisions.
e) Purchase of power
(₹ crore)
March 31,
2016 |
March 31,
2015 |
change (%) |
|
| Tata Steel | 2,743 |
2,570 |
7 |
| TSE | 1,865 |
2,254 |
(17) |
| NSH | 298 |
368 |
(19) |
| TSTH | 335 |
425 |
(21) |
| Others | 606 |
579 |
5 |
| Eliminations & Adjustments | (413) |
(283) |
46 |
| Group Total | 5,434 |
5,913 |
(8) |
Power Cost decrease at TSE and NSH primarily represents reduced production. Further, closure of Chinese operations at NSH and mothball of sites within Long Products Business and Strip UK in TSE resulted in lower expense. The decreases were partly offset by higher cost of consumption at Works and at FAMD in Tata Steel India.
f ) Freight and handling charges
(₹ crore)
March 31,
2016 |
March 31,
2015 |
change (%) |
|
| Tata Steel | 2,995 |
2,883 |
4 |
| TSE | 4,132 |
4,650 |
(11) |
| NSH | 143 |
218 |
(34) |
| TSTH | 30 |
37 |
(19) |
| Others | 814 |
1,069 |
(24) |
| Eliminations & Adjustments | (69) |
(46) |
50 |
| Group Total | 8,045 |
8,811 |
(9) |
The increase at Tata Steel India is mainly on account of increase in volumes and railway freight rates. Decrease at TSE is mainly on account of lower volumes and rates. Decrease in Others was primarily at TMILL due to handling of lower tonnages by its subsidiary at Dubai.
g) Other expenditure
(₹ crore)
March 31,
2016 |
March 31,
2015 |
change (%) |
|
| Tata Steel | 10,101 |
10,070 |
- |
| TSE | 19,773 |
20,936 |
(6) |
| NSH | 540 |
1,067 |
(49) |
| TSTH | 438 |
507 |
(14) |
| Others | 2,393 |
4,227 |
(43) |
| Eliminations & Adjustments | (1,941) |
(1,639) |
18 |
| Group Total | 31,304 |
35,168 |
(11) |
Other expenditures in Tata Steel India were almost at par with the previous year. Decrease at Tata Steel Europe is primarily on account of lower stores and other consumable cost, lower repairs and other maintenance cost owing to reduced production. At NatSteel, previous year included higher provision for doubtful advance of ₹444 crore (US$ 92 million). The decrease in Others is primarily due to favourable exchange rate movement at TSGH, Singapore.
Other expenditure represents the following expenditure:
(₹ crore)
March 31,
2016 |
March 31,
2015 |
change (%) |
|
| Stores & spares consumed | 10,667 |
11,877 |
(10) |
| Repairs to Building | 485 |
506 |
(4) |
| Repairs to Machinery | 5,963 |
6,025 |
(1) |
| Relining expenses | 118 |
133 |
(11) |
| Fuel oil consumed | 737 |
932 |
(21) |
| Conversion charges | 1,803 |
1,715 |
5 |
| Rent | 4,042 |
4,072 |
(1) |
| Royalty | 1,006 |
943 |
7 |
| Rates &Taxes | 1,260 |
1,276 |
(1) |
| Insurance charges | 377 |
467 |
(19) |
| Commission, rebates and discounts | 341 |
298 |
14 |
| Provision for wealth tax | - |
2 |
(99) |
| Provision for doubtful debts and advances | 162 |
395 |
(59) |
| Excise Duty | (37) |
114 |
(132) |
| Other expenses | 5,502 |
7,581 |
(27) |
| Less: Expenditure (other than interest) transferred to capital and other accounts | 1,122 |
1,168 |
(4) |
| Group Total | 31,304 |
35,168 |
(11) |
h) Finance costs and Net finance cost
(₹ crore)
March 31,
2016 |
March 31,
2015 |
change (%) |
|
| Tata Steel | 1,460 |
1,976 |
(26) |
| TSE | 3,670 |
4,078 |
(10) |
| NSH | 47 |
77 |
(39) |
| TSTH | 33 |
56 |
(42) |
| Others | 2,163 |
1,624 |
33 |
| Eliminations & Adjustments | (3,244) |
(2,963) |
10 |
| Group Total | 4,129 |
4,848 |
(15) |
Lower finance cost at Tata Steel India is primarily on account of higher interest capitalisation mainly on account of Kalinganagar. Decrease at TSE is primarily due to decrease in bank and other borrowings partly offset by addition of subordinate loan over last year.
(₹ crore)
March 31,
2016 |
March 31,
2015 |
change (%) |
|
| Tata Steel | 1,253 |
1,487 |
(16) |
| TSE | 3,663 |
4,056 |
(10) |
| NSH | 43 |
75 |
(42) |
| TSTH | 32 |
54 |
(41) |
| Others | (80) |
132 |
(160) |
| Eliminations & Adjustments | (1,123) |
(1,573) |
(29) |
| Group Total | 3,789 |
4,231 |
(10) |
Net finance charges were lower over the last year primarily due to the decrease in finance cost partly offset by decrease in finance income at Tata Steel India mainly due to lower profits from the sale of mutual funds.
i) Exceptional items
(₹ crore)
March 31,
2016 |
March 31,
2015 |
change (%) |
|
| Tata Steel | (1,583) |
1,891 |
(184) |
| TSE | (804) |
(3,595) |
(78) |
| NSH | (158) |
(2) |
- |
| TSTH | - |
- |
- |
| Others | (1,397) |
(2,704) |
(48) |
| Eliminations & Adjustments | (33) |
481 |
(107) |
| Group Total | (3,975) |
(3,929) |
1 |
Exceptional items during the Financial Year 2015-16 primarily represent provision for demands and claims (₹880 crore), charge on account of ESS under SBKY scheme: (₹556 crore) along with impairment of assets at Malda and Chhattisgarh project (₹125 crore) at Tata Steel India along with impairment of PPE relating to Strip UK assets (£743 mn: ₹7,319 crore), Longs Steel (£41 mn: ₹405 crore), Speciality, Bar, Packaging, Tubes and other business in the UK (£45 mn: ₹444 crore), Occupational Disease Claims (£70 mn: ₹690 crore) taken at Tata Steel Europe. Others primarily represent non-cash write-down of PPE and goodwill at certain subsidiaries (₹1,397 crore). Further, provision for write-off of total exposure at TSKZN at ₹144 crore and NatSteel Xiamen at ₹158 crore were also taken during the year.
j) Stores and spares stock
(₹ crore)
March 31,
2016 |
March 31,
2015 |
change (%) |
|
| Tata Steel | 1,888 | 1,807 | 5 |
| TSE | 910 | 945 | (4) |
| NS H | 82 | 112 | (27) |
| TSTH | 194 | 224 | (13) |
| Others | 217 | 230 | (5) |
| Group Total | 3,290 | 3,318 | (1) |
Stores and spares stock remained at par over previous financial year as decrease at NSH primarily on account of disposal of its subsidiaries, exchange impact on translation and lower volumes partly offset by increase at Tata Steel India.
k) Stock-in-trade
(₹ crore)
March 31,
2016 |
March 31,
2015 |
change (%) |
|
| Finished Goods | 7,528 | 9,158 | (18) |
| WIP | 4,337 | 4,764 | (9) |
| Raw materials | 5,201 | 7,910 | (34) |
| Total inventory | 17,066 | 21,832 | (22) |
text
(₹ crore)
March 31,
2016 |
March 31,
2015 |
change (%) |
|
| Tata Steel | 5,196 |
6,235 |
(17) |
| TSE | 10,515 |
13,710 |
(23) |
| NSH | 497 |
832 |
(40) |
| TSTH | 239 |
395 |
(39) |
| Others | 681 |
862 |
(21) |
| Eliminations & Adjustments | (62) |
(202) |
(69) |
| Group Total | 17,066 |
21,832 |
(22) |
At Tata Steel Europe, the reduction was (£192 mn - ₹1,886 crore) reflecting decline in prices particularly iron ore and coal along with lower tonnage owing to lower production. Decrease at Tata Steel India by ₹897 crore mainly due to reduction in raw materials inventory. These decreases were partly offset by higher inventory of Chrome Concentrate at Ferro Alloys and Mineral division by ₹50 crore on account of higher production subsequent to renewal of Sukinda mine from August 2015 and at Kalinganagar by ₹379 crore (mainly on account of increase in coal and coke stock procured for production of coke).
l) Sundry debtors
(₹ crore)
March 31,
2016 |
March 31,
2015 |
change (%) |
|
| Tata Steel | 633 | 491 | 29 |
| TSE | 7,832 | 7,921 | (1) |
| NSH | 389 | 451 | (14) |
| TSTH | 120 | 127 | (5) |
| Others & Eliminations | 2,727 | 4,320 | (37) |
| Group Total | 11,701 | 13,310 | (12) |
Decrease at Tata Steel Europe (TSE) and NatSteel reflects lower turnover owing to sluggish demand and weaker selling prices. The decreases were partly offset by increase at Tata Steel India primarily in long products owing to higher sales volumes. Reduction in Others represents lower securitisation of TSE debtors reflecting the movement in turnover.
m) Cash flow and Net debt Cash flow
(₹ crore)
March 31,
2016 |
March 31,
2015 |
change (%) |
|
| Net cash flow from operating activities | 11,963 | 11,880 | 1 |
| Net cash flow from investing activities | (10,424) | (8,422) | 24 |
| Net cash flow from financing activities | (3,928) | (2,617) | 50 |
| Net increase/ (decrease) in cash and cash equivalents | (2,389) | 841 | (384) |
Net cash flow from operating activities
The Group generated ₹11,963 crore from operations during Financial Year 2015-16 as compared to ₹11,880 crore in Financial Year 2014-15. The cash generated from operations before changes in working capital and tax payments during the current year was ₹8,175 crore against ₹13,955 crore in Financial Year 2014- 15 reflecting lower operating profits. Working capital decreased during the current period by ₹5,433 crore primarily due to decrease in Trade and other receivables coupled with decrease in inventories. These decreases were partly offset by decrease in Trade payable and other liabilities. The payments of income taxes during Financial Year 2015-16 were ₹1,645 crore as compared to ₹2,427 crore in Financial Year 2014-15.
Net cash from investing activities
Cash outflow during the current year was ₹10,424 crore as against an outflow of ₹8,422 crore in Financial Year 2014-15. The outflow in Financial Year 2015-16 represents capex of ₹11,486 crore which includes – TSI (₹5,828 crore), TSE (₹3,432 crore) and TSGMH (₹1,581 crore), purchase (net of sale) of current investment (₹3,122 crore) and purchase of shares in Tata Motors (₹376 crore). The outflows were partly offset by consideration received from sale of Tata Motors, Titan and Tata Projects (₹3,976 crore).
Net cash from financing activities
During the current year (loans availed net of loan repayments and interest payments) amounted to outflow of ₹3,928 crore as against ₹2,617 crore in Financial Year 2014-15. Current year outflow represents interest and loan issue expenses payment of ₹4,300 crore along with dividend paid ₹949 crore. These decreases were partly offset by net inflow on loans by ₹1,550 crore (primarily at Tata Steel India by ₹1,339 crore).
Thus, the net decrease in cash and cash equivalents was ₹2,389 crore excluding the effect of exchange fluctuation of ₹473 crore in the current period with a balance of ₹6,609 crore as on March 31, 2016 against a balance of ₹8,648 crore as on March 31, 2015.
Net debt
(₹ crore)
March 31,
2016 |
March 31,
2015 |
change (%) |
|
| Gross Debt | 86,204 | 80,702 | 7 |
| Less: Cash and Bank balances (incl. noncurrent balances) | 6,862 | 8,875 | (23) |
| Less: Current investments | 4,716 | 1,375 | 243 |
| Net Debt | 74,626 | 70,452 | 6 |
Net debt at ₹ 74,626 crore at March 31, 2016 was higher by 5.9% over March 31, 2015. Gross Debt at ₹86,204 crore at end of March 2016 was higher by ₹5,502 crore as compared to March 2015 at ₹80,702 crore. Fresh withdrawals were partly offset by repayments primarily at Tata Steel India and NatSteel Holdings, rest being exchange impact on translation. Cash and Cash Equivalents increased by ₹1,329 crore.
The Managing Director and the Group Executive Director (Finance & Corporate) make a declaration at each Board Meeting regarding compliance with provisions of various statutes after obtaining confirmation from respective units of the Company. The Company Secretary ensures compliance with all corporate laws and listing rules applicable to the Company.