|
Human Resource Management
|
|
|
|
|
UOM
|
FY18
|
FY19
|
FY20
|
FY21
|
FY22
|
FY23
|
|
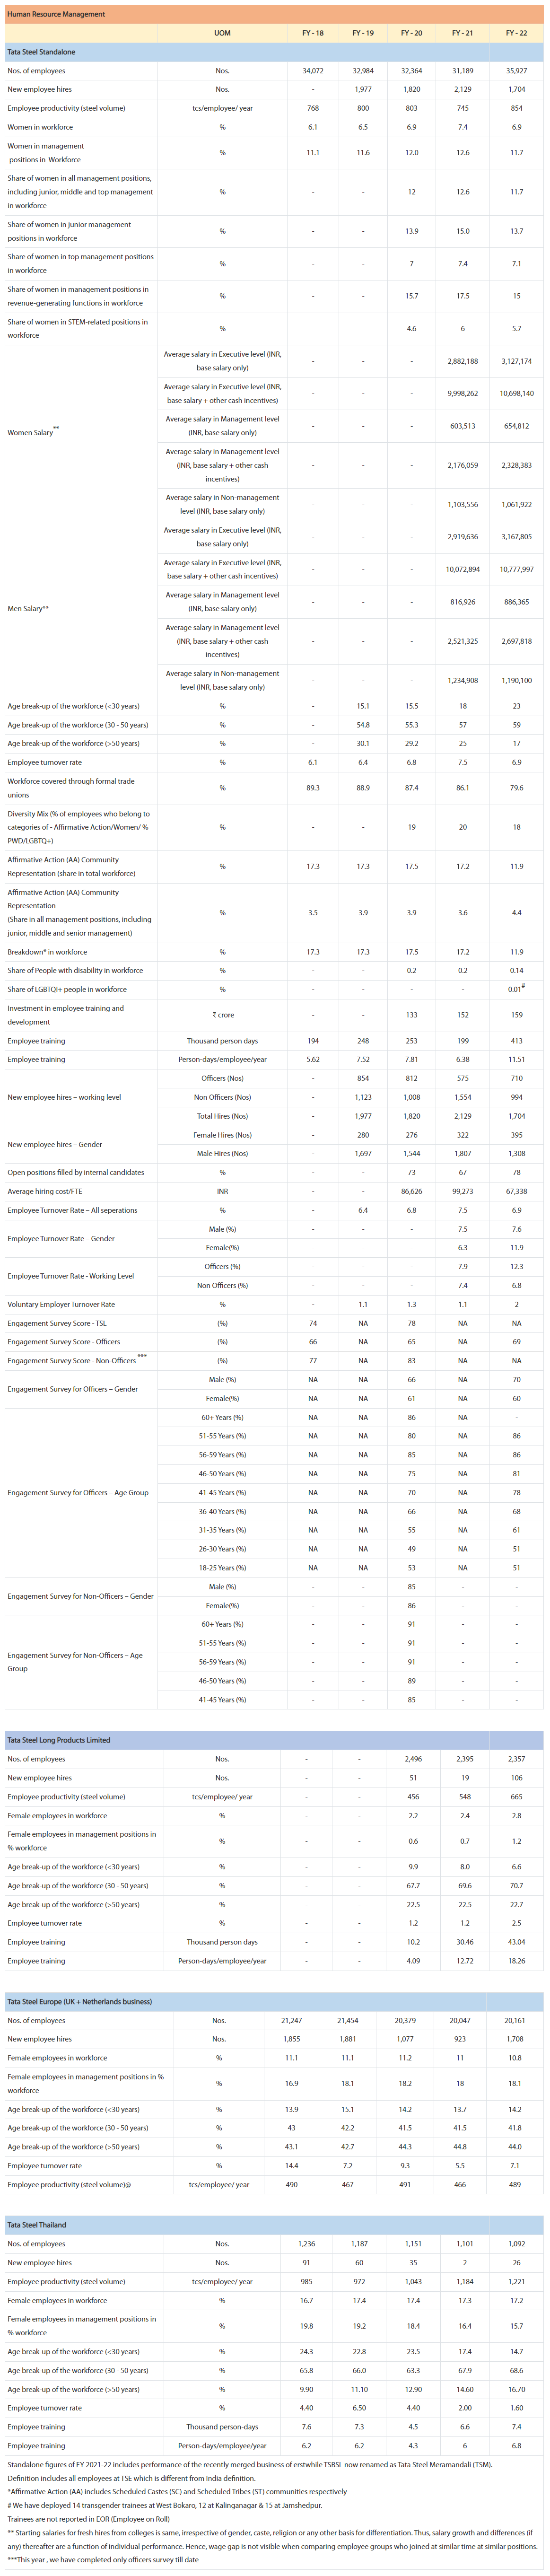
Tata Steel Standalone
|
|
Employees on roll
|
Nos.
|
34,072
|
32,984
|
32,364
|
31,189
|
35,927
|
36,151
|
|
New employee hires
|
Nos.
|
-
|
1,977
|
1,820
|
2,129
|
1,704
|
4,855
|
|
Employee productivity (steel volume)
|
tcs/employee/ year
|
768
|
800
|
803
|
745
|
854
|
885
|
|
Share of Women in workforce
|
%
|
6.1
|
6.5
|
6.9
|
7.4
|
6.9
|
7.6
|
|
Share of Women in management
positions in Workforce
|
%
|
11.1
|
11.6
|
12.0
|
12.6
|
11.7
|
11.5
|
|
Share of women in junior management positions, i.e. first level of management (as % of total junior management positions)
|
%
|
-
|
-
|
13.9
|
15.0
|
13.7
|
13.15
|
|
|
Share of women in top management positions in workforce
|
%
|
-
|
-
|
7
|
7.4
|
7.1
|
7.30
|
|
Share of women in management positions in revenue-generating functions in workforce
|
%
|
-
|
-
|
15.7
|
17.5
|
15
|
14.20
|
|
Share of women in STEM-related positions in workforce
|
%
|
-
|
-
|
4.6
|
6
|
5.7
|
6.10
|
|
Women Salary**
|
Average salary in Executive level (INR, base salary only)
|
-
|
-
|
-
|
28.82
|
31.27
|
36.75 lakh
|
|
Average salary in Executive level (INR, base salary + other cash incentives)
|
-
|
-
|
-
|
99.98
|
106.98
|
138.18 lakh
|
|
Average salary in Management level (INR, base salary only)
|
-
|
-
|
-
|
6.04
|
6.55
|
6.56 lakh
|
|
Average salary in Management level (INR, base salary + other cash incentives)
|
-
|
-
|
-
|
21.76
|
23.28
|
20.83 lakh
|
|
Average salary in Non-management level (INR, base salary only)
|
-
|
-
|
-
|
11.04
|
10.62
|
10.2 lakh
|
|
Men Salary**
|
Average salary in Executive level (INR, base salary only)
|
-
|
-
|
-
|
29.20
|
31.68
|
38.06 lakh
|
|
Average salary in Executive level (INR, base salary + other cash incentives)
|
-
|
-
|
-
|
100.73
|
107.78
|
131.36 lakh
|
|
Average salary in Management level (INR, base salary only)
|
-
|
-
|
-
|
8.17
|
8.86
|
8.51 lakh
|
|
Average salary in Management level (INR, base salary + other cash incentives)
|
-
|
-
|
-
|
25.21
|
26.98
|
23.4 lakh
|
|
Average salary in Non-management level (INR, base salary only)
|
-
|
-
|
-
|
12.35
|
11.90
|
12.1 lakh
|
|
Age break-up of the workforce (<30 years)
|
%
|
-
|
15.1
|
15.5
|
18
|
23
|
19.40
|
|
Age break-up of the workforce (30 - 50 years)
|
%
|
-
|
54.8
|
55.3
|
57
|
59
|
56.10
|
|
Age break-up of the workforce (>50 years)
|
%
|
-
|
30.1
|
29.2
|
25
|
17
|
24.50
|
|
Workforce covered through formal trade unions
|
%
|
89.3
|
88.9
|
87.4
|
86.1
|
79.6
|
91.00
|
|
Diversity Mix (% of employees who belong to categories of - Affirmative Action/Women/ % PWD/LGBTQ+)
|
%
|
-
|
-
|
19
|
20
|
18
|
18.95
|
|
Affirmative Action (AA) Community
Representation (share in total workforce)
|
%
|
-
|
-
|
-
|
-
|
11.9
|
11.80
|
|
Affirmative Action (AA) Community Representation
(Share in all management positions, including junior, middle and senior management)
|
%
|
3.5
|
3.9
|
3.9
|
3.6
|
4.4
|
4.42
|
|
Share of People with disability in workforce
|
%
|
-
|
-
|
-
|
0.3
|
0.3
|
0.30
|
|
Share of LGBTQI+ people in workforce
|
%
|
-
|
-
|
-
|
-
|
0.003
|
0.20
|
|
Investment in employee training and development
|
₹ crore
|
-
|
-
|
133
|
152
|
159
|
193
|
|
|
Average investment in employee training & development
|
INR
|
-
|
-
|
41095
|
48735
|
44256
|
53,387.18
|
|
Employee training
|
Thousand person days
|
194
|
248
|
253
|
199
|
413
|
468
|
|
|
Person-days/employee/year
|
5.62
|
7.52
|
7.81
|
6.38
|
11.51
|
12.93
|
|
|
Average Hours per FTE
|
50.58
|
67.68
|
70.29
|
57.42
|
103.59
|
116.44
|
|
|
Average Hours per FTE - Officers
|
-
|
-
|
-
|
-
|
-
|
94.26
|
|
|
Average Hours per FTE - Non-Officers
|
-
|
-
|
-
|
-
|
-
|
124.11
|
|
Technical/ Functional Training
|
Average Hours per FTE
|
|
|
|
|
|
115.00
|
|
Managerial training
|
Average Hours per FTE
|
|
|
|
|
|
1.44
|
|
New employee hires – working level
|
Officers (Nos)
|
-
|
854
|
812
|
575
|
710
|
964.00
|
|
Non Officers (Nos)
|
-
|
1,123
|
1,008
|
1,554
|
994
|
3,891.00
|
|
Total Hires (Nos)
|
-
|
1,977
|
1,820
|
2,129
|
1,704
|
4,855.00
|
|
New employee hires – Gender
|
Female Hires (Nos)
|
-
|
280
|
276
|
322
|
395
|
885.00
|
|
Transgender Hires (Nos)
|
-
|
-
|
-
|
-
|
-
|
134.00
|
|
Male Hires (Nos)
|
-
|
1,697
|
1,544
|
1,807
|
1,308
|
3,386.00
|
|
Open positions filled by internal candidates
|
%
|
-
|
-
|
73
|
67
|
78
|
66
|
|
Average hiring cost/FTE
|
INR
|
-
|
-
|
86,626
|
99,273
|
67,338
|
90,401.00
|
|
Employee Turnover Rate – All seperations
|
%
|
6.1
|
6.4
|
6.8
|
7.5
|
6.9
|
8.2
|
|
Employee Turnover Rate – (Resignations)
|
%
|
|
|
|
1.2
|
2
|
2.70
|
|
Voluntary Employer Turnover Rate (Resignations)
|
%
|
-
|
|
|
1.1
|
2
|
2.70
|
|
Employee Turnover Rate (Resignations) – Gender
|
Male (%)
|
-
|
-
|
-
|
-
|
1.6
|
2.50
|
|
Female(%)
|
-
|
-
|
-
|
-
|
5.8
|
5.90
|
|
Employee Turnover Rate (Resignations) - Working Level
|
Officers (%)
|
-
|
-
|
-
|
-
|
6.6
|
6.70
|
|
Non Officers (%)
|
-
|
-
|
-
|
-
|
0.3
|
0.80
|
|
Engagement Survey Score - Officers
|
(%)
|
66
|
NA
|
65
|
NA
|
69
|
72.00
|
|
|
Engagement Survey Score - Non-Officers ***
|
(%)
|
77
|
NA
|
83
|
NA
|
NA
|
-
|
|
Engagement Survey for Officers – Gender
|
Male (%)
|
NA
|
NA
|
66
|
NA
|
70
|
73.00
|
|
Female(%)
|
NA
|
NA
|
61
|
NA
|
60
|
63.00
|
|
Engagement Survey for Officers – Age Group
|
60+ Years (%)
|
NA
|
NA
|
86
|
NA
|
-
|
100.00
|
|
51-55 Years (%)
|
NA
|
NA
|
80
|
NA
|
86
|
83
|
|
56-59 Years (%)
|
NA
|
NA
|
85
|
NA
|
86
|
85
|
|
46-50 Years (%)
|
NA
|
NA
|
75
|
NA
|
81
|
83
|
|
41-45 Years (%)
|
NA
|
NA
|
70
|
NA
|
78
|
80
|
|
36-40 Years (%)
|
NA
|
NA
|
66
|
NA
|
68
|
69
|
|
31-35 Years (%)
|
NA
|
NA
|
55
|
NA
|
61
|
67
|
|
26-30 Years (%)
|
NA
|
NA
|
49
|
NA
|
51
|
57
|
|
18-25 Years (%)
|
NA
|
NA
|
53
|
NA
|
51
|
63
|
|
Engagement Survey for Non-Officers – Gender
|
Male (%)
|
-
|
-
|
85
|
-
|
-
|
-
|
|
Female(%)
|
-
|
-
|
86
|
-
|
-
|
-
|
|
Engagement Survey for Non-Officers – Age Group
|
60+ Years (%)
|
-
|
-
|
91
|
-
|
-
|
-
|
|
51-55 Years (%)
|
-
|
-
|
91
|
-
|
-
|
-
|
|
56-59 Years (%)
|
-
|
-
|
91
|
-
|
-
|
-
|
|
46-50 Years (%)
|
-
|
-
|
89
|
-
|
-
|
-
|
|
41-45 Years (%)
|
-
|
-
|
85
|
-
|
-
|
-
|
 Corporate
 Sustainability
 Products & Solutions
 Investors
 Media
Media
 Careers
 Contact Us