INPUTS
Financial Capital
Net Worth (` Cr.)
72,730
Gross Debt (` Cr.)
29,701
Manufactured Capital
TSL capacity – Crude Steel (MnT)
13
Steel processing centres - Own (Nos.)
37
Intellectual Capital
Collaborations/memberships (Technical Institutes)* (Nos.)
40
Patents filed* (Nos.)
1,058
R&D spend (` Cr.)
216
Human Capital
Employees on roll (Nos.)
32,984
Investment in employee training and development (` Cr.)
~133
Employee training (mandays/employee/year)
7.52
Natural Capital
TSL - Energy intensity (Gcal/tcs
5.82
TSL - Specific water consumption (m3/tcs)
3.5
Captive iron ore (%)
100
Captive coal (%)
27
Inbound raw materials (MnTPA)
~ 40
Capital spend on environment (` Cr.)
286
Social & Relationship Capital
Pan India dealers and distributors (Nos.)
12,000+
Application engineers working jointly with customers (Nos.)
43
Customer-facing processes (Nos.)
11
Customer service teams (Nos.)
25
Supplier base (Nos.)
> 5,000
CSR spend (` Cr.)
315
VALUE CREATION APPROACH
Our Vision
We aspire to be the global steel industry benchmark for value creation and corporate citizenship
TATA CODE OF CONDUCT POLICIES THAT GOVERN OUR BUSINESSOur Values
INTEGRITY
EXCELLENCE
UNITY
RESPONSIBILITY
PIONEERING
Strategic Objectives
- SO1
INDUSTRY LEADERSHIP IN STEEL
- SO2
CONSOLIDATE POSITION AS A GLOBAL COST LEADER
- SO3
INSULATE REVENUES FROM STEEL CYCLICALITY
- SO4
INDUSTRY LEADERSHIP IN CORPORATE SOCIAL RESPONSIBILITY AND SAFETY, HEALTH AND ENVIRONMENT
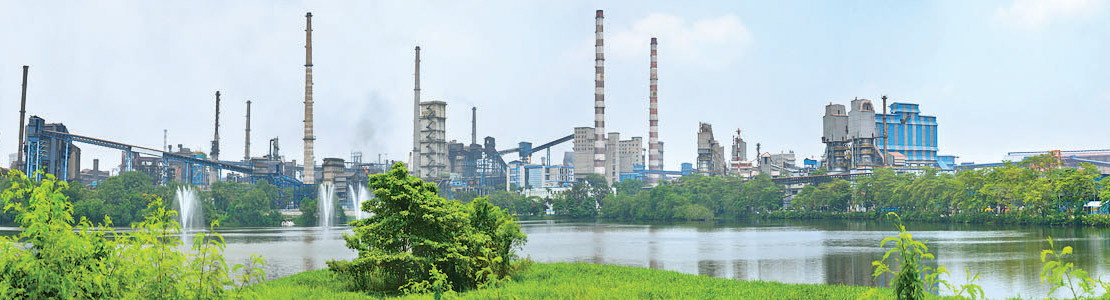
Panview of Jamshedpur Steel Plant
Tata Steel Value Chain
OUTPUTS

14.24 MnT
Hot metal production

13.23 MnT
Crude steel production

12.7 MnT
Total sales

9.4 MnT
Flat product sales

3.3 MnT
Long product
sales

~17 MnT
By-products generated
OUTCOMES
Financial Capital
Turnover (` Cr.)
70,611
EBITDA Margin (%)
29
PAT (` Cr.)
10,533
Savings through improvement projects (Shikhar25) (` Cr.)
2,801
Shikar25: EBITDA improvement programme
Intellectual Capital
Patents granted# (Nos.)
476
Human Capital
Fatalities (Nos.)
2
LTI (Nos.)
68
Health index (Score on 16)
12.62
Diversity % women in the workforce
~6.5
Diversity % Affirmative action community in the workforce
~17
Employee productivity (tcs/employee/year)@
800
Natural Capital
TSL - Solid waste utilisation (%)
99
Total raw materials sites covered (%) under biodiversity management plan
100
TSL GHG emission intensity (tCO2e/tcs)
2.34
TSL Dust emission intensity (kg/tcs)
0.42
TSL Effluent discharge intensity (m3/tcs)
0.78
Social & Relationship Capital
Suppliers assessed based on safety (Nos.)
1,035
Customer satisfaction index (Steel) (out of 100)
81.6
Net Promoter Score (out of 100) - Tata Tiscon
81
Net Promoter Score (out of 100) - Tata Shaktee
81
Enriched/value-added products sales (MnT)
8.6
Suppliers trained through VCAP** (Nos.)
1,426
Quality/customer complaints (PPM)
444
Lives touched through CSR initiatives (Nos.)
>1.1 Mn