COMPANY OVERVIEW
Established in Jamshedpur in 1907, Tata Steel, a Company that took shape from the vision of Jamsetji N. Tata, is today a global business enterprise having products and services in over 150 countries. Being the world’s second-most geographically diversified steel producer, we operate in 26 countries, have commercial presence in over 50 countries and have employees spread across five continents.
Tata Steel is among the top global steel companies with an annual crude steel capacity of 27.5 MnTPA. The Tata Steel Group recorded a consolidated turnover of `1,17,420 crore in FY2017.
Tata Steel India has an end-to-end value chain that extends from mining to finished steel goods, catering to an array of market segments. The Jamshedpur facility has an annual crude steel capacity of 10 MnTPA and the Kalinganagar plant has a capacity of 3 MnTPA.
We embrace different skills, celebrate diversity and strive for constant innovation, while continuing to act responsibly in the use of natural resources. Above all, our commitment to give back to the society helps us make our vision of sustainable growth a reality.
Vision
We aspire to be the global steel industry benchmark for ‘Value Creation' and 'Corporate Citizenship’.
Mission
Consistent with the vision and values of the Founder, Jamsetji Tata, Tata Steel strives to strengthen India’s industrial base through the effective utilisation of staff and materials.
Tata Steel recognises that while honesty and integrity are the essential ingredients of a strong and stable enterprise, profitability provides the main spark for economic activity.
Overall, the Company seeks to scale the heights of excellence in all that it does in an atmosphere free from fear and, thereby, reaffirms its faith in democratic values.
Values
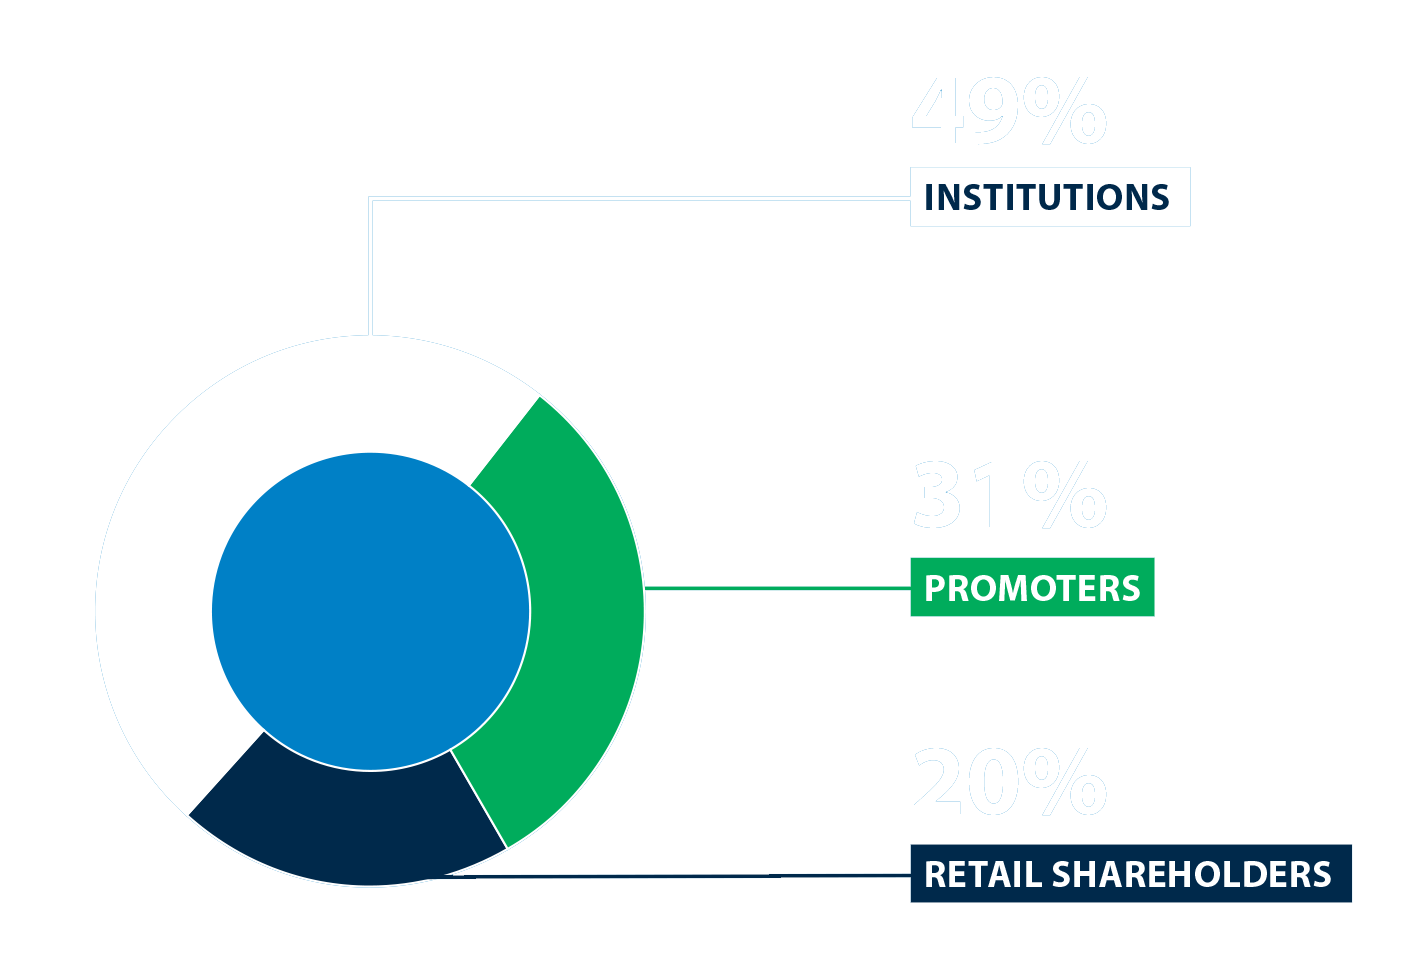
Integrity | Unity | Pioneering | Excellence | ResponsibilityOwnership Structure
Tata Steel is headquartered in Mumbai, India. Our ownership (as of March 31, 2017) is diversely held as depicted.
Leadership Structure
We have a well-defined operating structure to ensure that the Company is on track to achieve its vision and strategic objectives. Our executive management rests with Mr. T. V. Narendran, Managing Director for our Indian and South-East Asian operations and Mr. Koushik Chatterjee, Group Executive Director (Finance, Corporate & Europe) Mr. Narendran and Mr. Chatterjee, operationally and administratively report to our Chairman, Mr. N. Chandrasekaran and functionally report to the Board of Directors. The executive team responsible for operations such as Raw Materials, Steel Making, Sales and Marketing among others reports to the Managing Director. Corporate functions such as Finance and Accounts, Legal, Secretarial, Communications and Regulatory Affairs, among others, report to the Group Executive Director (Finance, Corporate and Europe). We have a strong, diverse, highly qualified and richly experienced leadership team with a track record of excellence and passion for performance.
Financial Performance
Our strong performance is due to supportive realisations and strong growth in deliveries due to ramp up of our Kalinganagar plant. Our plant in Kalinganagar continues to ramp up well both in terms of quantity and quality.
KEY PERFORMANCE INDICATORS (Tata Steel India)
EBITDA/TURNOVER (%)
PBET/ TURNOVER (%)
RETURN ON AVERAGE CAPITAL EMPLOYED (%)
RETURN ON AVERAGE NET WORTH (%)
BASIC EARNINGS PER SHARE (` PER SHARE)
NET DEBT/ EQUITY (TIMES)
Our ROCE was 9.8% reflecting the efficiency with which we use our capital.