Report Menu

Company Overview

We are in the business of
steel-making for the last 111 years

Established in Jamshedpur, India in the year 1907, Tata Steel is part of the 150-year-old Tata group. Bringing to reality the vision of its founder, J. N. Tata, who inspired the steel and power industry in India, the Tata Steel Group is the 10th largest steel manufacturer in the world and is known to be the hallmark of corporate citizenship and business ethics.

KNOW MORE
25.27 MnT

Deliveries

65,000+

Employees

`1,33,016 Cr.

Revenue 13% increase y-o-y

`22,045 Cr.

EBITDA 29.5% increase y-o-y

`17,763 Cr.

Profit After Tax (PAT)

21%

Improvement in Lost-time Injury
Frequency Rate (LTIFR) over
FY 2016-17

Vision

We aspire to be the global steel industry benchmark for ‘Value Creation’ and ‘Corporate Citizenship’.

We make the difference through:

Our People

Our Policies

Our Offerings

Our Innovative Approach

Our Conduct

Mission

Consistent with the vision and values of the founder Jamsetji Tata, Tata Steel strives to strengthen India’s industrial base through effective utilisation of staff and materials. The means envisaged to achieve this are cutting-edge technology and high productivity, consistent with modern management practices

Tata Steel recognises that while honesty and integrity are the essential ingredients of a strong and stable enterprise, profitability provides the main spark for economic activity.

Overall, the Company seeks to scale the heights of excellence in all it does in an atmosphere free from fear, and thereby reaffirms its faith in democratic values.

Values

  • Integrity
  • Excellence
  • Unity
  • Responsibility
  • Pioneering

Performance Highlights (Tata Steel India)

Financial Capital

We generate our financial capital annually in the form of surplus arising from the current business operations as well as through financing activities, which include restructuring of debts aligned with the market conditions and other investments.

Know More
  • `60,519 Cr.

    Turnover

  • `4,170 Cr.

    PAT

  • 26%

    EBITDA

  • `2,527 Cr.

    Capex

Manufactured Capital

We continually invest in our integrated steel plants, consisting of our iron-making, steel-making and rolling facilities and warehouses, along with the logistics operations, while ensuring the safety and reliability of the operations.

Know More
  • 12.48 MnT

    Total Crude Steel Production

  • 8.9 MnT

    Flat Products Sales

  • 3.3 MnT

    Long Products Sales

  • `2,594 Cr.

    Savings through improvement projects

  • 6.5 MnT

    Enriched / value-added products sales

Intellectual Capital

Our thrust on innovation and research is of paramount importance for our product development and it also reinforces our operational efficiency and resource optimisation drive, while adhering to the Standard Operating Procedures (SOPs).

Know More
  • 964

    Patents Filed

  • 418

    Patents Granted

  • `1,987 Cr.

    Revenue from new products

  • `3,290 Cr.

    Revenue from by-products

  • `181.64 Cr.

    Spend on R&D

Human Capital

Our people form the core of our operations. We invest in employee welfare and happiness to drive performance excellence. Our work culture ensures safety, health, competency enhancement and the overall well-being of our employees.

Know More
  • 64

    Lost-time Injuries (LTIs)

  • 3

    Fatalities

  • 0.29

    LTIFR

  • 6.11%

    Women in the workforce

  • 17.29%

    Underprivileged community in the workforce

  • 738 tcs / employee / year

    Productivity (at TSJ)

  • 918 tcs / employee / year

    Productivity (at TSK)

Relationship Capital

We believe in building long-term, transparent and trust-based relationship with our partners, while adhering to applicable norms and corporate ethics. We also invest in building our partners’ capabilities and sharing knowledge with them.

Know More
  • 81

    Customer Satisfaction Index

  • 606 PPM

    Customer complaints (at TSJ)

  • 5,000

    Supplier Base

  • 12,000

    Channel Partners

  • 34

    Collaborations with technical institutes

Natural Capital

We depend on the stock of natural resources such as iron ore, coal and other minerals, which constitute our key raw materials. At the same time, resources such as land and water are indispensable for our operations.

Know More
  • 2.30 tCO2e/tcs

    CO2 emissions (at TSJ)

  • 2.65 tCO2e/tcs

    CO2 emissions (at TSK)

  • 3.68 m3/tcs

    Specific Water Consumption (at TSJ)

  • 4.75 m3/tcs

    Specific Water Consumption (at TSK)

  • 5.67 Gcal/tcs

    Energy Intensity (at TSJ)

  • 7.29 Gcal/tcs

    Energy Intensity (at TSK)

Social Capital

Harmonious presence among our neighbouring communities bears a testimony to the value we place in community development initiatives, while partnering with them in their growth story.

Know More
  • ᐳ 1 Mn people

    CSR Outreach

  • `232 Cr.

    Spend on CSR

Know More

TSJ: Tata Steel Jamshedpur TSK: Tata Steel Kalinganagar PPM: Parts Per Million m3/tcs: Cubic metre per tonne of crude steel
tCO2e/tcs: Tonnes of carbon dioxide equivalent per tonne of crude steel Gcal/tcs: Giga calories per tonne of crude steel tcs: Tonne of crude steel

Chairman’s Messages

Dear Stakeholders,

It is a privilege to write to you again as the Chairman
of the Board of Tata Steel. During 2018, the Tata group
founded by Jamsetji N. Tata is celebrating its 150 years.
This is a proud moment in history for all stakeholders
of the Tata group and Tata Steel has been an integral
part of the rich heritage of the Group.

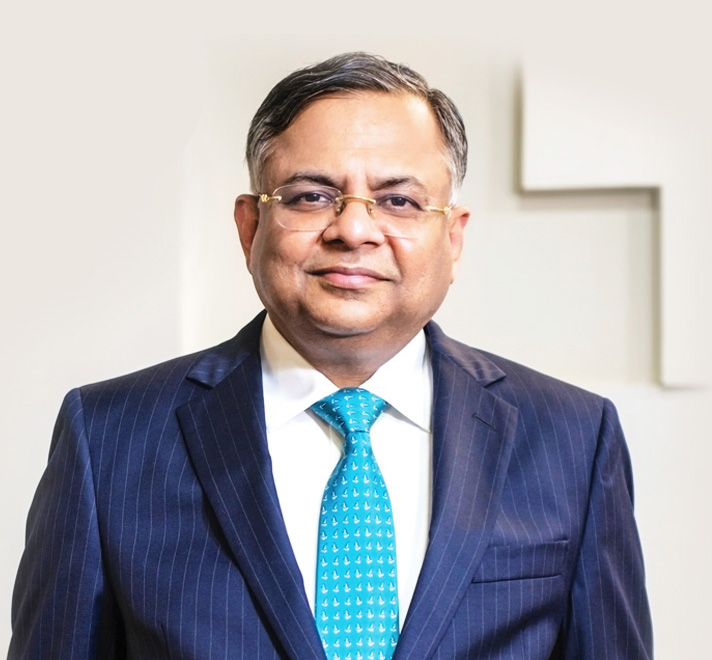
Natarajan Chandrasekaran Chairman of the Board

Know More

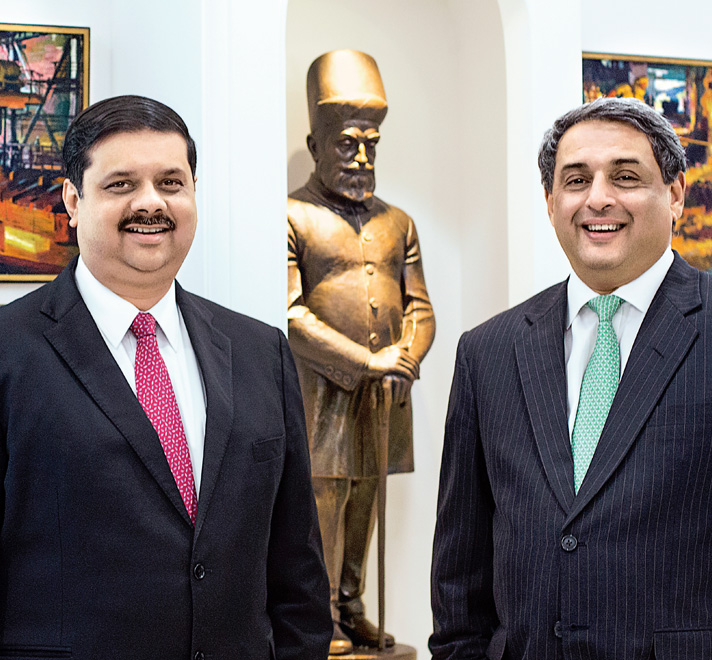
A dialogue with the CEO and CFO

Primary focus is on
growth and expansion

Our focus over the next decade will
also be to work towards becoming
an industry leader in research and
development

Know More

Financial Performance Key Performance Indicators (Tata Steel India)

EBITDA / Turnover (%)

PBET / Turnover (%)

Return on Average Capital Employed (%)

Return on Average Net Worth (%)

Basic Earnings per Share (` / Share)

Net Debt / Equity (Times)

Note: FY14 and FY15 as per I GAAP and FY16 to FY18 as per IndAS

Our Growth Drivers

Macro-economic Indicators

Business Environment
FY 2017-18

3.8%

Growth in Global GDP

Growth recovery primarily driven by :
  • - Increase in global manufacturing activity
  • - Resilient growth in China driven by supply side reforms
  • - Pickup in commodity prices
  • - Favourable financing conditions globally
6.7%

Growth in India’s GDP

Consumption led growth influenced by
Government policies and investments.

Outlook for
FY 2018-19

3.9-4%

Growth in Global GDP

Extension of policy stimulus to sustain growth and increase in commodity prices especially in metals and crude oil expected.
7-7.5%

Growth in India’s GDP

Driven by increased Government spending on infrastructure and thrust on developmental projects as well as consumption led growth coupled with strong growth in service sector.

Implications for Steel industry during FY 2017-18

  • Global macro environment was conducive to stability of steel industry
  • Steel demand growth and higher raw material prices led to nearly
    20% increase in steel price in FY18
QBM: Quarterly Benchmark, GDP: Gross Domestic Product,
ASEAN: Association of Southeast Asian Nations, MENA: Middle East and North Africa
* Data for calendar year CY 2017

Outlook for the Steel Industry for FY 2018-19

  • Growth in demand and price stability expected for steel industry
** Data for calendar year CY 2018

Our Growth Drivers

Finished Steel Demand

Business Environment
FY 2017-18

1,587* MnT

Global Steel Demand

Grew at nearly 2% driven by
  • - Growth in India (5%)
  • - Growth in ASEAN and MENA (5-6%)
  • - Growth in China (2.9%)
82 MnT

Indian Steel Demand

Grew at 7.8% fuelled by growth in Auto (14.8%) and Construction (5.7%).

Outlook for
FY 2018-19

1,616** MnT

Global Steel Demand

India, ASEAN and MENA – expected to grow at 5-6% to be a key driver.
87 MnT

Indian Steel Demand

Expected to revive with recovery in construction and capital goods sectors.

Implications for Steel industry during FY 2017-18

  • Global macro environment was conducive to stability of steel industry
  • Steel demand growth and higher raw material prices led to nearly
    20% increase in steel price in FY18
QBM: Quarterly Benchmark, GDP: Gross Domestic Product,
ASEAN: Association of Southeast Asian Nations, MENA: Middle East and North Africa
* Data for calendar year CY 2017

Outlook for the Steel Industry for FY 2018-19

  • Growth in demand and price stability expected for steel industry
** Data for calendar year CY 2018

Our Growth Drivers

Raw Materials

Business Environment
FY 2017-18

69 ($/t)

Iron ore fine price Cost and Freight
(CFR) China

Led by resilient growth in China’s steel demand due to
supply side reforms.
198 ($/t)

Hard Coking coal - QBM Price Free on
Board (FoB) Australia

Chinese policies and environmental restrictions led to increased seaborne trade of coking coal and firmed up prices.

Outlook for
FY 2018-19

70 ($/t)

Iron Ore Fine Price Cost and
Freight (CFR) China

Prices expected to be range bound, Fe premiums to remain at high levels.
198 ($/t)

Coking coal - QBM Price Australia
Free on Board (FoB)

Price volatility expected to remain due to supply uncertainties arising from unpredictable extreme weather.
Demand from China will continue to be a key driver for seaborne prices.

Implications for Steel industry during FY 2017-18

  • Global macro environment was conducive to stability of steel industry
  • Steel demand growth and higher raw material prices led to nearly
    20% increase in steel price in FY18
QBM: Quarterly Benchmark, GDP: Gross Domestic Product,
ASEAN: Association of Southeast Asian Nations, MENA: Middle East and North Africa
* Data for calendar year CY 2017

Outlook for the Steel Industry for FY 2018-19

  • Growth in demand and price stability expected for steel industry
** Data for calendar year CY 2018

Our Approach to Value Creation

Our approach to value creation is based on our vision, which lays equal emphasis on creating value for our business and our stakeholders as well as on being a responsible corporate citizen.

At Tata Steel, corporate governance and ethical business practices are guided by the Tata Code of Conduct (TCoC). We have documented policies that provide direction on various aspects of Sustainability such as Quality, Research, Human Resources, Safety and Health, Environment, Climate Change and Corporate Social Responsibility.

Know More

Key Sustainable Development Goals for Tata Steel

3
Good Health
and well-being

6
Clean wather
and sanitation

8
Decent work and
economic growth

12
Responsible
Consumption
and Production

13
Climate Action