Business Model
Input
Financial Capital
Net worth (₹ crore)98,768
Net debt (₹ crore)80,144
Human Capital
Employees on roll (nos.)77,000+
Training hours per employee (nos.)76
Employee training (thousand
person-days)529+
Manufactured Capital
Installed crude steel capacity
(MTPA)36
Social and Relationship Capital
Total dealers and distributors
(nos.)27,000+
Active supplier base (nos.)14,000+
CSR spend* (nos.)473
Intellectual Capital
Collaborations/memberships with technical institutes
(nos.)170+
Patents filed (nos.)160+
Natural Capital
Energy intensity (GJ/tcs)22.16
Specific freshwater consumption
(m3/tcs)2.30
Capital spends on ESG matters (₹
crore)6,300+
Value Chain
1
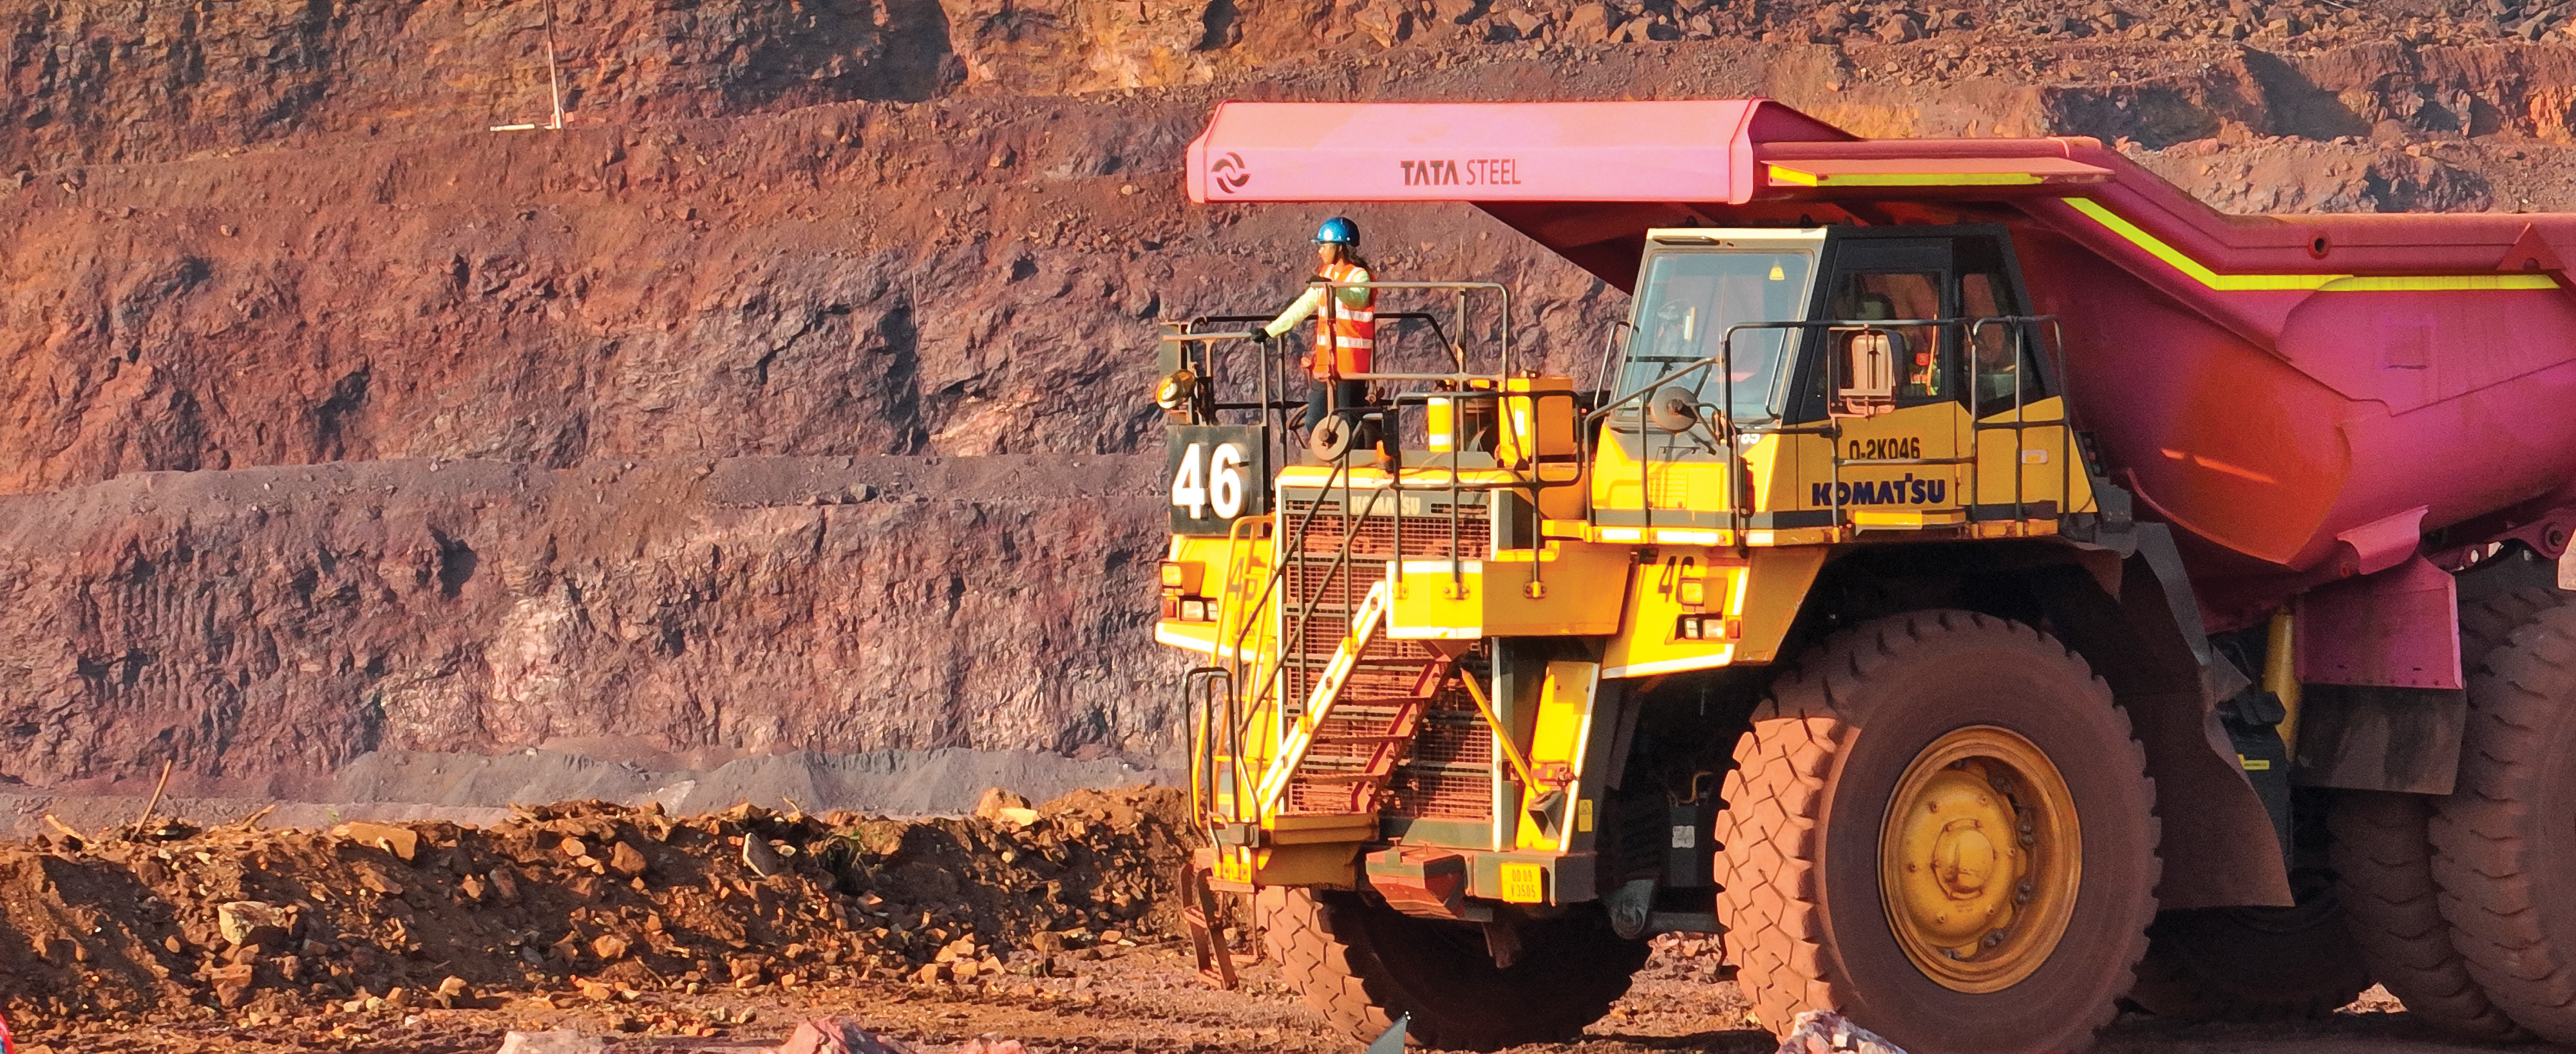
Mining
53.47 MT
Materials mined
2
Processing raw material
3
Iron making
4
Steelmaking
31.67 MT
Production
5
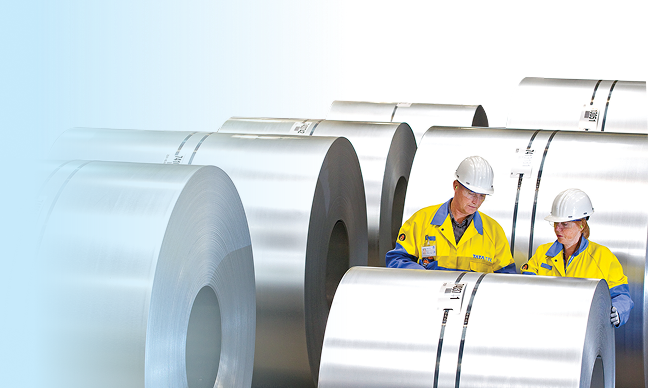
Rolling product
20.48 MT
Enriched/value-added product sales
6
Downstream processing
60
Steel processing centres
7
Customers
31.97 MT
Deliveries
Enabling functions
Supply chain
33+ MT
Finished goods handled
100+ MT
Raw material handled
Human resources
937 tcs/employee/year
Employee productivity^
Technology
₹1,456 crore
R&D spend
By-products
₹9,100+ crore
Revenue from by-product sales
Digitalisation
360+
Digital projects undertaken
The Steelmaking Process
Output
31.67 MT
Production
20.48 MT
Enriched/value-added product sales
31.97 MT
Deliveries
Outcome
Financial Capital
Turnover (₹ crore)2,32,140
EBITDA (₹ crore)34,848
Savings through cost transformation programme
(₹ crore)10,868
(₹ crore)10,868
Social and Relationship Capital
Suppliers assessed on safety (nos.)2,200+
Business associates trained on TCoC
(nos.)5,100+
Supply chain partners assessed on RSCP
(nos.)3,444
Lives impacted through CSR initiatives*
(million)6.9+
Manufactured Capital
Production (MT)31.67
Natural Capital
CO₂ emission intensity^
(tCO₂/tcs)2.22
Stack dust emission intensity^
(kg/tcs)0.30
Solid waste utilisation (including legacy
stock)^
(%)100
Effluent discharge intensity^
(m³/tcs)10.36
SOx emission intensity^
(kg/tcs)1.89
NOx emission intensity^
(kg/tcs)0.97
Total sites covered under Biodiversity Management
Plans^
(nos.)29
Human Capital
Women
in managerial roles (%)10
Diversity mix (%)18
LTI^ (nos.)222
LTIFR^ (Index) 0.48
Workforce (permanent non-managerial)
under formal trade unions^ (%)84
under formal trade unions^ (%)84
Intellectual Capital
Patents granted (nos.)200+
New products developed (nos.)120+
* Metrics applicable to Tata Steel Limited