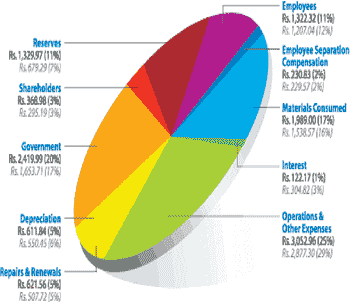
| Distribution of Revenue 2003-2004
(Rs. in crores) |
 |
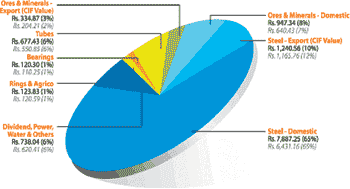
Rupee Earned 2003-2004
(Rs. in crores) |
|
| |
 |
|
| Performance
of TIS Group Companies (FY 2003-2004 Actuals Compared With Previous Year) |
| |
| FY 2002-2003 ACTUALS |
|
COMPANY |
|
FY 2003-2004 ACTUALS |
|
CHANGE OVER PY |
| INCOME |
PBT |
|
INCOME |
PBT |
INCOME |
PBT |
| 24,076 |
202 |
TCIL |
31,056 |
2,134 |
6,980 |
1,932 |
| 8,949 |
627 |
TAYO |
9,352 |
596 |
403 |
(32) |
| 18,036 |
1,282 |
TRYL |
33,671 |
2,538 |
15,635 |
1,256 |
| 21,324 |
734 |
TRL |
28,149 |
2,658 |
6,826 |
1,924 |
| 14,845 |
2,561 |
TSIL |
18,304 |
5,307 |
3,549 |
2,746 |
| 11,717 |
2,201 |
TML |
14,700 |
3,797 |
2,984 |
1,596 |
| 4,938 |
1,329 |
JAMIPOL |
5,514 |
1,300 |
576 |
(29) |
| 1,638 |
138 |
TPL |
1,816 |
280 |
178 |
141 |
| 7,310 |
777 |
TMILL |
11,556 |
1,334 |
4,246 |
557 |
| 499 |
189 |
Metaljunction.com |
1,173 |
613 |
674 |
424 |
| 13,732 |
(94) |
TRF |
17,460 |
529 |
3,728 |
623 |
| 3,130 |
205 |
SUL
(1) |
5,388 |
508 |
2,258 |
303 |
| 130,193 |
10,152 |
TOTAL
(12 Nos.) |
178,139 |
21,594 |
47,947 |
11,442 |
This is additional information beyond the scope of this
report.
|

