EN10 EMISSIONS
| Emission through
process stacks |
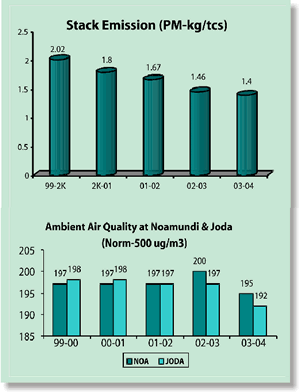
Tata Steel has undertaken several initiatives, which have
resulted in considerable reduction in stack emission as evidenced in the figure in the box
alongside. Indian standards (norms) for SO2, NOx, & PM for stacks in steel
plants are furnished below along with actual values monitored during the reporting period.
Total emission load for past two years are also furnished below. The emission loads are
calculated based on the actual measurement of PM, SO2 & NOx. The flue gas
volume for Coke Oven, Power Houses chimneys is based on calculations based on carbon
inputs to the boilers and Coke Ovens. For all other stacks the actual volume flow is
measured. The emission for crude gas bleeding & coke quenching towers are estimated
based on industry norms. On an average two-sample measurement are taken per point source
in a year. Emissions from A-F BF Cast House and CAL incinerator stacks have not been
included in this report.
| Sl. No. |
Process
Stacks Attached to |
Air
Pollutant |
Indian Standard |
Actual Value (01-02) |
Actual Value (02-03) |
Actual Value (03-04) |
| 1 |
Blast Furnace
Stoves |
PM
SO2
NOx |
150 mg/Nm3
No Standard
No Standard |
15-84
121-191
74-117 |
16.4-29.1
61-152
116-204 |
16.4-85.4
48-126
16-192 |
| 2 |
Sinter Plant |
PM
SO2
NOx |
150 mg/Nm3
No Standard
No Standard |
113-325
69-487
57-235 |
36-83
81-487
88-267 |
116-148
164-265
29-267 |
| 3 |
Refractories
Production
Department |
PM
SO2
NOx |
150 mg/Nm3
No Standard
No Standard |
32-83
3-11
103-141 |
40.3-83.7
4-12
103-157 |
53-136
7-310
67-336 |
| 4 |
Steel Melting Shops |
PM |
150 mg/Nm3 |
28-44 |
38.8-128.4 |
37.9-128 |
| 5 |
Coke Plant
Waste Gas |
PM
SO2
NOx |
50 mg/Nm3
800 mg/Nm3
500 mg/Nm3 |
18-476
83-544
109-437 |
49.4-132
63-573
180-479 |
19.3-107
61-570
150-443 |
| 6 |
Captive Power Plants |
PM |
350 mg/Nm3 |
27-138 |
26.5-314.8 |
15-136 |
| Emission load from
Steel Works - tonnes/annum |
| Parameter |
01-02 |
02-03 |
03-04 |
| Particulate
Matter, tpa |
6396 |
5980 |
5832 |
| Sulphur-di-oxide,
tpa |
17941 |
11081 |
9949 |
| Oxides of
Nitrogen, tpa |
12247 |
8025 |
7534 |
The emission loads do not include fugitive
emissions. These emissions represent approximately 90% emissions from the scope of the
report.
 The gross emissions loads are
presented only for the Steel Works. The loads for other units will be provided in
subsequent years. This methodology for monitoring and reporting is described in
Annexure-VI. The gross emissions loads are
presented only for the Steel Works. The loads for other units will be provided in
subsequent years. This methodology for monitoring and reporting is described in
Annexure-VI.
|
|
|
