
Directors' Report
To the Members,
Your Directors take pleasure in presenting the 107th annual report on the business and operations of your Company along with the standalone and consolidated summary financial statements for the year ended 31st March, 2014.
| Rs.crores | |||||
| Tata Steel Standalone | Tata Steel Group | ||||
| 2013-14 | 2012-13 | 2013-14 | 2012-13 | ||
| Net revenue from Operations | 41,711.03 | 38,199.43 | 148,613.55 | 134,711.54 | |
| Total expenditure before finance cost, depreciation | 28,894.13 | 27,073.19 | 132,202.54 | 122,390.33 | |
| (net of expenditure transferred to capital) | |||||
| Operating Profit | 12,816.90 | 11,126.24 | 16,411.01 | 12,321.21 | |
| Add: Other income | 787.64 | 902.04 | 516.81 | 479.15 | |
| Profit before finance cost, depreciation, exceptional items and taxes | 13,604.54 | 12,028.28 | 16,927.82 | 12,800.36 | |
| Less: Finance costs | 1,820.58 | 1,876.77 | 4,336.83 | 3,968.11 | |
| Profit before depreciation, exceptional items and taxes |
11,783.96 | 10,151.51 | 12,590.99 | 8,832.25 | |
| Less: Depreciation | 1,928.70 | 1,640.38 | 5,841.22 | 5,575.32 | |
| Profit before exceptional items and taxes | 9,855.26 | 8,511.13 | 6,749.77 | 3,256.93 | |
| Add/(Less): Profit on sale of non-current Investments | – | 12.33 | 18.20 | 966.03 | |
| Add/(Less): Provision for diminution in the value of | (141.76) | (686.86) | (45.84) | (8,355.91) | |
| investment/doubtful advances/impairment of non-current assets | |||||
| Profit before taxes | 9,713.50 | 7,836.60 | 6,722.13 | (4,132.95) | |
| Less: Provision for current taxation | 3,098.02 | 1,770.54 | 3,482.64 | 2,325.40 | |
| Less: Provision for MAT credit | – | (399.84) | (0.21) | (410.12) | |
| Less: Provision for deferred taxation | 203.29 | 1,402.93 | (424.27) | 1,314.16 | |
| Profit/(Loss) after taxes | 6,412.19 | 5,062.97 | 3,663.97 | (7,362.39) | |
| Add: Share of profit of Associates | – | – | 0.84 | 90.31 | |
| Less: Minority Interest | – | – | (69.92) | (214.46) | |
| Profit/(Loss) after tax, minority interest and share of profit of associates | – | – | 3,594.89 | (7,057.62) | |
| Distribution on hybrid perpetual securities | 266.04 | 266.21 | 266.04 | 266.21 | |
| Tax effect on distribution of hybrid perpetual securities | (90.43) | (86.37) | (90.43) | (86.37) | |
| 6,236.58 | 4,883.13 | 3,419.28 | (7,237.46) | ||
| Add: Balance brought forward from the previous year | 24,616.17 | 21,145.04 | 7,039.38 | 16,125.42 | |
| Add: Profit and Loss account balance relating to acquisitions | 33.97 | – | – | – | |
| Balance | 30,886.72 | 26,028.17 | 10,458.66 | 8,887.96 | |
| Which the Directors have apportioned as under to: - | |||||
| (i) | Dividend on Preference Shares | – | – | 0.10 | 0.21 |
| (ii) | Proposed dividend on Ordinary Shares | 971.21 | 776.97 | 971.21 | 776.97 |
| (iii) | Tax on Dividends | 66.19 | 128.73 | 80.22 | 226.41 |
| (iv) | General Reserve | 641.22 | 506.30 | 730.16 | 665.56 |
| (v) | Statutory Reserve | – | – | – | 8.29 |
| (vi) | Special Reserve | – | – | 1.60 | 161.28 |
| (vii) | Capital Redemption Reserve | – | – | 49.62 | 9.86 |
| Total | 1,678.62 | 1,412.00 | 1,832.91 | 1,848.58 | |
| Balance to be carried forward | 29,208.10 | 24,616.17 | 8,625.75 | 7,039.38 | |
dividend
The Board recommended a dividend of Rs.10 per Ordinary Share on 97,12,15,405 Ordinary Shares for the year ended 31st March 2014. (Financial Year 2012-13: Rs.8 per Ordinary Share on 97,12,15,229 Ordinary Shares of Rs.10 each).
The dividend on Ordinary Shares is subject to the approval of the shareholders at the Annual General Meeting. The total dividend payout works out to 16% (Financial Year 2012-13: 18%) of the net profit for the standalone results.
global economic conditions
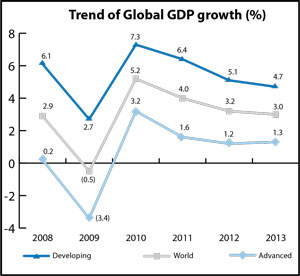
The world Gross Domestic Product (GDP), as reported by the International Monetary Fund (IMF), witnessed a growth of 3% in 2013 as compared to a growth of 3.2% in 2012. Both advanced economies and emerging and developing economies witnessed the slowdown in growth at 1.3% and 4.7% respectively.
 However, in the second half of the Financial Year 2013-14, macroeconomic conditions showed a sign of stabilisation in certain developed regions including Europe but the growth remains anemic. Similarly, the GDP growth in India at 4.7% in Financial Year 2013-14, marks a second straight year of sub-5% growth – the worst slowdown in more than a quarter of a century. This is largely attributed to sluggish growth in investments and tight monetary policy by the Reserve Bank of India leading to demand contraction.
Global Steel Outlook
Tata Steel is the world's second most geographically diversified steel company with significant exposure in India and Europe.
As per the World Steel Association, the global apparent steel use is likely to grow by 3.1% in 2014 to 1,527 million tonnes and by 3.3% to 1,576 million tonnes in 2015 as opposed 3.6% growth in 2013. In India, steel demand is expected to grow by 3.3% to 76.2 million tonnes in 2014 and by 4.5% to 79.6 million tonnes in 2015, following a marginal 1.8% growth in 2013.
Similarly, the apparent steel use for EU (28) is expected to grow by 3.1% in 2014 to 143.3 million tonnes and 3% to 147.6 million tonnes in 2015 as compared to a de-growth of -0.2% in 2013. This will help to recoup the demand in construction and automotive segments, which have almost bottomed out.
Growth of the Chinese economy, which in recent years has been one of the main demand drivers in the global mining and steel industries, has continued to slow down in the last 12-18 months, along with other emerging economies. A slow economic recovery in North America, continued stagnation in Europe and a continued slowdown in emerging economies including India and China would impact the global manufacturing and metals industry like Steel.
A recent release (April 2014) of quantitative risk assessment in the World Economic and Financial Survey by the International Monetary Fund (IMF) suggests that recession risks have decreased slightly for the major economies and have remained broadly unchanged for other economies. However, the risk of Eurozone crisis and a hard landing for China cannot be ruled out.
tata steel group performance
The momentum provided by the ramp up of all the production units under the 2.9 mtpa expansion plan at Jamshedpur, stabilisation of rebuild Blast Furnace#4 at Port Talbot, UK, significant growth in sales volume of operating entities of Nat Steel Holdings (Singapore) at Vietnam and China and an increase in deliveries in Tata Steel Thailand, contributed to record gross deliveries of 26.6 million tonnes by the Tata Steel Group during the Financial Year 2013-14. This was higher by 10% compared to the previous year deliveries of 24.1 million tonnes.
The consolidated profit before interest, depreciation, exceptional items and taxes (EBITDA) of the Group was Rs.16,928 crores in the Financial Year 2013-14, higher by 32% over the previous year. Consequently, the consolidated profit before exceptional items and taxes (PBT) was Rs.6,750 crores in the Financial Year 2013-14 compared to Rs.3,257 crores in the previous year.
Indian operations:
During the Financial Year 2013-14 the Company fully ramped up to its installed capacity of 9.7 million tonnes at Jamshedpur and continued with the full-fledged construction and installation of facilities for 3 million tonnes crude steel greenfield capacity expansion at Odisha. There has been an overall increase of ~ 12% to 14% in the production and sales volumes of the Indian operations over last year. The Company had a record production of 9.89 million tonnes of Hot Metal and 8.93 million tons of Saleable Steel during the year. Similarly, the Company reported the best ever deliveries of 8.52 million tonnes during the financial year. This has led to significant efficiency gains and a richer product mix. The Company has also invested in widening its customer base in India. The increase in sales has been achieved without sacrificing the product premium. The profit before interest, depreciation, exceptional items and taxes (EBITDA) for standalone Tata Steel was Rs.13,605 crores for the Financial Year 2013-14, higher by 13% compared to the previous Financial Year.
There were several best performances recorded by many units of the Company during the Financial Year 2013-14 some of which are as follows:
Production
- Best ever total agglomerate production of 12.14 million tonnes (Previous best - 10.22 million tonnes in the Financial Year 2012-13).
- Steel Melting Shop LD#3 achieved its best ever production of 2.23 million tonnes (Previous best - 1.02 million tonnes in the Financial Year 2012-13).
- Cold Rolling Mill achieved its highest ever production of 1.64 million tonnes (Previous best - 1.56 million tonnes in Financial Year 2009-10).
- TSCR achieved its highest ever production of 2.18 million tonnes (Previous best - 0.99 million tonnes in the Financial Year 2012-13).
Sales
- Best ever annual sales to the Automotive segment at 1.17 million tonnes (Previous best - 1.05 million tonnes in Financial Year 2012-13).
- Best ever annual sales in Industrial Products segment at 1.7 million tonnes (63% more than the previous best in Financial Year 2012-13 at 1.07 million tonnes).
- Best ever annual sales in LPG segment at 110 kt and a market share of 23%.
Kar Vijay Har Shikhar (KVHS), an initiative launched during Financial Year 2010-11, focussed on the Company's aspiration to improve its EBITDA. It is a multi-unit, multi-location, cross functional improvement programme spanning the entire value chain from mining to marketing and sales of finished steel. The Company achieved an improvement in savings of Rs.1,614 crores in the Financial Year 2013-14, which included a KVHS contribution of Rs.1,170 crores.
Customer centricity has been the key focus area for Tata Steel and to align the actions even more closely, the Company has taken a step change in reorganising its Marketing & Sales organisation in line with the market segments i.e. Auto & Special Products, Branded and Retail, Industrial Products and downstream units.
European operations:
Tata Steel Europe (TSE) completed two major upgrades of the key production facilities (the rebuild of Blast Furnace 4 at Port Talbot during an eight month period ending February 2013 and the repair of the hearth in Blast Furnace 7 at IJmuiden in the March 2013) at the end of Financial Year 2012-13, which has strengthened its operating platform. This resulted in higher liquid steel production volumes of 2.2 million tonnes during the year under review.
Tata Steel Europe's (TSE) turnover for the Financial Year 2013-14 was 3% lower than the previous year. This is due to the decrease in the average revenue per tonne caused primarily by the deterioration in the market conditions in the first half of Financial Year 2013-14, even though it was partly offset by a 6% increase in steel deliveries, attributable largely to a full year of operations by the two blast furnaces at Port Talbot.
Record performances in TSE's operations during the Financial Year 2013-14 included the following:
- At IJmuiden, the best ever total Hot Strip Mill output of 5.21 million tonnes (previous best of 5.05 million tonnes in Financial Year 2011-12); the best ever total Direct Sheet Plant output of 1.26 million tonnes (previous best was 1.19 million tonnes in Financial Year 2006-07); and the best ever total hot dipped galvanising line output at DVL3 of 552 thousand tonnes (previous best was 465 thousand tonnes in Financial Year 2012-13).
- At Port Talbot, the best ever total hot metal make at Blast Furnace 4 (2.05 million tonnes - previous best of 1.91 million tonnes in Financial Year 2002); the best ever total hot metal make for the site (4.16 million tonnes - previous best of 3.86 million tonnes in Financial Year 2007); the best ever total liquid steel make (4.55 million tonnes - previous best of 4.41 million tonnes in Financial Year 2007); and the best ever total slab make (4.45 million tonnes - previous best of 4.29 million tonnes in Financial Year 2006-07).
Tata Steel Europe has launched a multi-year transformation journey under the banner OGSM ("Objectives, Goals, Strategies & Measures") in the Financial Year 2010-11. The above programme is expected to structurally change the organisational health covering productivity improvement through operating performance, supply chain management, product differentiation and customer management, cost management including right sizing manpower and optimising the asset network. The systematic deployment of the OGSM tool has yielded significant EBITDA benefits since the time of the launch. The continued focus on operating costs achieved savings of around £ 200 million, which contributed towards improved year on year EBITDA performance at Rs.3,008 crores during the Financial Year 2013-14. This almost quadrupled as compared to previous year.
TSE continued to implement its strategy of market differentiation and launched 30 new products as planned during the year. The volume of new products sold increased by about 75% and sales of differentiated products also grew by 16% in comparison to the previous year.
Moreover, to generate a more sustainable performance, TSE continues to focus on customers and innovation driven strategy. As a result, the Company achieved following customer successes during the year:
- Network Rail, the owner and operator of rail infrastructure in the UK, has chosen to source more than 95% of its rail from Tata Steel Europe until 2019.
- Schneider Electric selected TSE for its Preferred Supplier 2013 award.
- Royal Mint recognised TSE as the Most Innovative Supplier for the third year running.
- GOLD in the Caterpillar Supplier Quality Excellence Process for its global supply of track shoe profiles was awarded to TSE.
- Toyota awarded a Certificate of Recognition to TSE's important contribution in the area of quality.